
Figure 2.
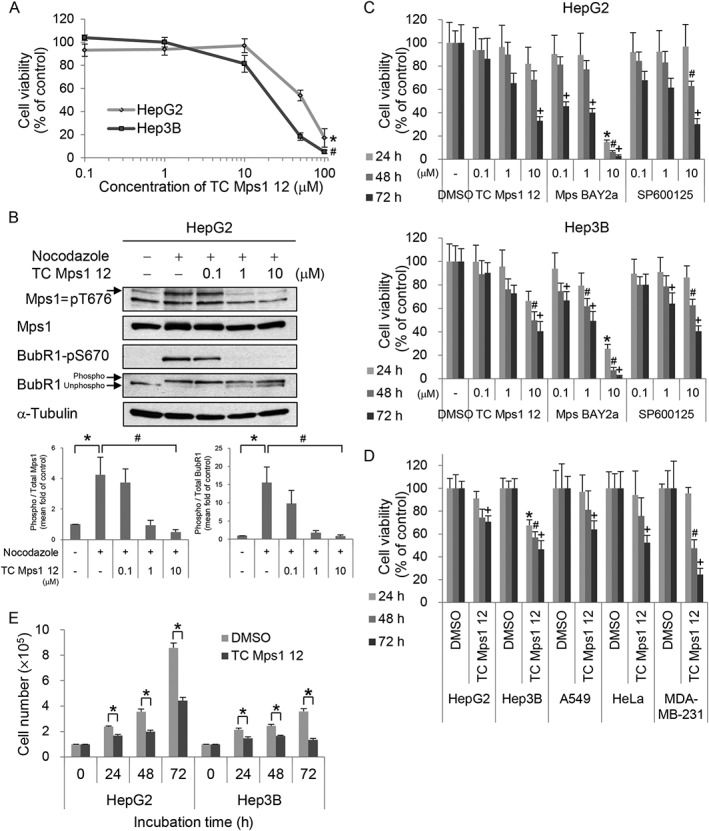
TC Mps1 12‐treated HCC cells show a defect in cell proliferation. (A) HepG2 and Hep3B cells were treated with various concentrations of TC Mps1 12 for 24 h. Viability was determined by the MTT assay. *P < 0.05 and # P < 0.05 by Kruskal–Wallis test followed by Dunn's test, significantly different from corresponding HepG2 and Hep3B control cells respectively. (B) HepG2 cells were treated with 0.2 μg·mL−1 nocodazole for 24 h and then treated with the indicated concentrations of TC Mps1 12 for 60 min. The levels of phospho‐proteins were quantified using ImageJ software. *P < 0.05 by Mann–Whitney test, significantly different from control cells, and # P < 0.05 by Kruskal–Wallis test followed by Dunn's test, significantly different from nocodazole‐treated cells. (C) HepG2 and Hep3B cells were treated with the indicated concentrations of several Mps1 inhibitors for the indicated times. Viability was determined using the MTT assay. *P < 0.05, # P < 0.05 and + P < 0.05 by one‐way ANOVA followed by Tukey's HSD test, significantly different from corresponding DMSO‐treated cells at 24, 48 and 72 h respectively. (D) HepG2, Hep3B, A549, HeLa and MDA‐MB‐231 cells were treated with 10 μM TC Mps1 12 for the indicated times. Viability was determined by the MTT assay. *P < 0.05, # P < 0.05 and + P < 0.05 by Student's unpaired t‐test, significantly different from corresponding DMSO‐treated cells at 24, 48 and 72 h respectively. (E) HepG2 and Hep3B cells were treated with 10 μM TC Mps1 12 for the indicated times. Viability was determined by the trypan blue exclusion test. *P < 0.05 by Student's unpaired t‐test, significantly different from corresponding DMSO‐treated cells. Each value is expressed as mean ± SEM (n = 5).