Abstract
Background and Purpose
Coated pellets are widely used as oral drug delivery systems, being highly accepted by patients and with several advantages compared to single unit devices. However, their behaviour needs to be elucidated so as to improve the effectiveness of the formulations and reduce production costs. In spite of this important issue, few mathematical modelling studies have been attempted, mostly due to the complexities arising from the system's polydispersity (non‐homogeneous multiple‐unit particulate systems), which has been scarcely investigated using mechanistic models.
Experimental approach
A mechanistic mathematical model was developed that was able to describe the single pellet behaviour in terms of hydration, drug dissolution, diffusion and release and particle size. This model was then extended to describe and predict the behaviour of mono‐ and polydispersed ensembles of pellets.
Key Results
The polydispersity arising from the size and distribution of the inert core was shown to have a minimal effect on the drug release profile, whereas the thickness and distribution of the polymeric film was found to be the key parameter determining the drug release.
Conclusions and Implications
The mechanistic model developed, which is capable of determining the polydispersity of the drug delivery system, was able to predict the release kinetics from ensembles of pellets and to highlight the key parameters that need to be controlled in the production of pellet‐based drug delivery systems, demonstrating its use as a powerful predictive tool.
Abbreviations
- HPMC
hydroxypropyl methylcellulose
- ICs
initial conditions
- ODEs
ordinary differential equations
- PSD
particle size distribution
- SD
size distribution
Introduction
Generalities
The oral route for drug administration is one of the most commonly used methods to deliver drugs due to high patient compliance and the large mass‐exchange surface available in the gastrointestinal tract. Many oral pharmaceuticals are prepared as multiple‐unit particulate systems, as these offer several advantages over a single unit device. These multi‐unit systems reduce the local drug concentration and are less likely to result in gastric irritation (Grassi et al., 2006), have faster gastric emptying and longer residence time in the intestine (Abrahamsson et al., 1996). Among the particulate systems, coated pellets are most often used to obtain controlled drug release. The insoluble polymer layer covers the pellets, finely modulates the drug release, masks any undesirable taste of the drug and improves its stability by protecting the inner part from the external environment (Siepmann et al., 2008).
State of the art
The modelling of ensembles of coated pellets is a complicated task due to the polydispersed character of non‐homogeneous multiple‐unit particulate systems, and few mathematical modelling studies have been attempted. Dappert and Thies (1978) with their statistical‐based model, followed by Gross et al. (1986) and Donbrow et al. (1988), have demonstrated that the cumulative release of a polydispersed system does not characterize the basic release mechanism, and they clearly showed that the form of the release profile from a single pellet differs from the release profile of an ensemble. Dappert and Thies (1978) also demonstrated that the cumulative amount of drug released from a particular ensemble of polydispersed particles can be deduced from the cumulative release of each particle class. A particle class defines a dimensional range in which a certain number or mass (numerical or mass distribution) of particles can be individuated. The particles in each class can be described by the average dimension of the class (i.e. mean diameter). In their model, the mutual interaction between particle classes was disregarded. Grassi et al. (2000) utilized a mechanistic model to analyse the drug release from an ensemble of swellable, cross‐linked polymer particles with a known initial particle size distribution (PSD). Borgquist et al. (2002; 2004) developed a mechanistic model to describe drug release from ensembles of coated pellets but ignored the interaction between the dimensional classes of pellets. Other models have been attempted and some of these are reported in Kaunisto et al. (2011). However, most of these mechanistic studies have ignored the interaction between ensembles of particles with the same size, namely, ‘classes’, that is, they assumed the drug released from one class does not influence the drug release from the other classes (perfect sink condition), and considered the polydispersity generated only by difference in internal drug core radius, disregarding variations in the thickness of the polymer film. To our knowledge, a mathematical model able to describe the mass fraction evolution of all the species along with the system deformation, accounting for the size distribution (SD) of the different layers has never been proposed in the case of coated pellets.
Aims
There are two aims in this present study. The first is to develop a mechanistic (or first principles) mathematical model able to describe the drug dissolution and release, as well as the system deformation, from a single pellet made of an inert core, a drug and a polymer layer. The second is to describe the behaviour of an ensemble of mono‐ and polydispersed pellets through the extension of the single pellet model. The polydispersity will be considered as potentially arising from the SD of each pellet layer.
Methods
The materials and methods used to produce the coated pellets and test the drug release will be briefly reported.
Materials
The inert cores of pellets were made of microcrystalline cellulose spheres (Cellets® 500, Syntapharm GmbH, Germany). Anhydrous theophylline, our model drug, was bought from Sigma‐Aldrich (St. Louis, MO, USA). Hydroxypropyl methylcellulose (HPMC) 5 cP, used as plasticizer within the drug layer, was a gift from Dow Chemical (Midland, MI, USA). The coating was made of Surelease®E‐7‐19 020, aqueous ethyl cellulose dispersion (24.7% w.w‐1, Colorcon, Harleysville, PA, USA). Sodium phosphate monobasic monohydrate and disodium phosphate for the preparation of buffered release medium were bought from Sigma‐Aldrich (St. Louis, MO, USA).
Production of coated pellets
The pellets analysed in this work were produced by the solution/suspension layering technique, which requires a starter core (nucleation seed) to promote the process. The coating was performed in a fluid bed coater equipped with a Wurster column (Gandalf 0, AstraZeneca, Sweden) in two steps. In the first step, the Cellets spheres (starter core) were coated with a theophylline : HPMC solution (90:10 w.w‐1) to produce the drug layer. In the second step, the drug‐covered pellets were coated with the aqueous ethyl cellulose dispersion to obtain the polymeric film layer. The theophylline : HPMC (weight ratio 90:10) solution was sprayed onto microcrystalline cores. These coated pellets were sprayed with ethyl cellulose layers using Surelease (15% w.w‐1) at an inlet temperature of 45°C and cured at 50°C for 24 h in an oven. The operative conditions were chosen to produce a theoretical drug layer thickness of 12 μm and theoretical polymeric film thickness of 20, 30 and 60 μm respectively (ft20, ft30, ft60). The theoretical film thickness in microns is denoted as ftx, where x is the thickness value.
Drug release
Drug release from an ensemble of pellets, 500 mg, was analysed in a USP II apparatus (Varian 705DS, Varian Inc., Palo Alto, CA, USA) at 37°C, 100 rpm in 1 L of phosphate buffer (pH 6.8). Samples of 3 mL were automatically collected (8000 Dissolution sampling station, Agilent Technologies, Santa Clara, CA, USA) and analysed by a spectrophotometer (Cary 60 UV‐Vis, Agilent Technologies, Santa Clara, CA, USA) at 272 nm to calculate the drug concentration in the medium and the drug release profiles.
Surelease film properties
Diffusivity measurements
The diffusivity of the water and theophylline within the polymeric film was measured in a diffusion cell with a donor and an acceptor compartment separated by a square piece (1.5 × 1.5 cm) of the polymeric film. The amount of tritium‐labelled water and theophylline passing from the donor to the acceptor compartment were monitored, respectively, with a scintillation counter (TriCarb 2810TR, PerkinElmer, Walthalm, MA, USA) and a spectrophotometer (Cary 60 UV‐Vis, Agilent Technologies, Santa Clara, CA, USA) at 272 nm.
Swelling of Surelease free film
Three free films of Surelease with a weight of 36.1 ± 4.2 mg and a thickness of 141.8 ± 9.6 μm were put in 100 mL of distilled water at 37°C and hydrated. The films were withdrawn at different times, in the interval 0–80 h, and weighed to determine the weight variation attributed to the amount of water absorbed.
Particle size distribution of Cellets
The PSD of Cellets 500 was estimated with a laser scattering granulometer (Mastersizer 3000, Malvern, Worcestershire, UK), equipped with the Hydro EV apparatus to create wet dispersions. Distilled water was used as the dispersant.
Polymer and drug thickness layers
The thickness of the polymeric layer was measured by analysing cross sections of the pellets. The procedure to obtain pellets cross sections for the SEM images is the following: The pellets were immobilized in paraffin wax and cut with a cryostat‐microtome (Electronic cryostat Cryotome E, Thermo Electron Corporation, Runcorn, UK). Cross sections of the pellets were analysed with an optical microscope (Leica DMLP, Leica Microsystems, Milan, Italy); these were obtained by immobilizing the pellets in polyester resin (Solver Italia, Salerno, Italy) and cutting with a semi‐automated rotary microtome (Leica RM2245, Leica Microsystems, Milan, Italy).
Modelling
Phenomenology
A pellet is depicted schematically in Figure 1. The phenomenological hypotheses are the following:
The water from the external environment (ΩD) diffuses into the pellet through the coating (ΩC), which swells (RC(t) increases), causing hydration of the internal parts;
The drug and the HPMC dissolve, with the same kinetics, from the solid layer (ΩA: RA(t) decreases) into the liquid layer (ΩB: RB(t) increases);
The dissolved drug from the liquid layer diffuses through the polymeric coating (ΩC) and accumulates in the external environment (ΩD);
Meanwhile, the liquid layer continues to increase in volume due to the water coming in from ΩC (RB(t) increases), causing the stretching of the polymeric coating ΩC (RC(t) − RB(t) decreases) due to its limited capacity to swell.
Figure 1.
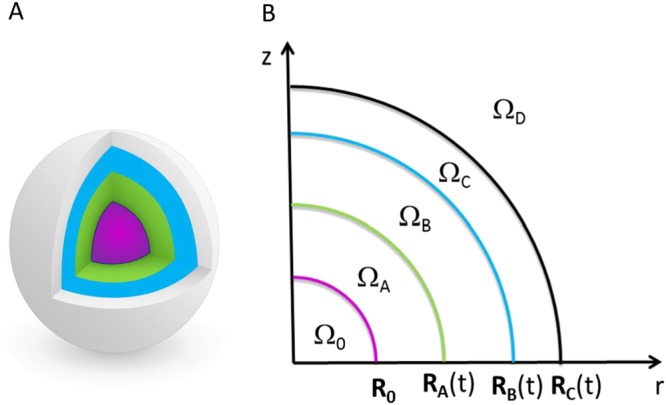
3D representation of a pellet (A) with its 2D axisymmetric schematization (B). Ω0 represents the inert core (Cellets) with fixed radius R0. ΩA represents the solid drug layer (drug and HPMC) with the time‐dependent outer radius RA(t). ΩB represents the dissolved drug layer (drug, HPMC and water) with time‐dependent outer radius RB(t). ΩC represents the polymeric film layer (Surelease, drug and water) with the time‐dependent outer radius RC(t). ΩD represents the dissolution medium (drug and water) in which the pellet is immersed.
Although it has been observed, experimentally, that the Cellets swell in PBS resulting in an increased radius by about 10% in this model, this phenomenon is disregarded, because the water reaches the core only once the drug layer has been completely dissolved and almost completely released. The inclusion of this effect, even if it is not difficult to be implement, would require other parameters to be defined – like the water diffusivity and the MCC/water equilibrium constant – that are not easily available and would add little in terms of depiction of real behaviour. Osmotic pressure driven release, which is manifested in the case of polymeric film as pores/cracks, is not considered in this work.
Single pellet modelling
The system is described with a lumped approach, so that each domain has a homogeneous value of mass fraction of each species. In each domain, the mass balances for the N‐1 species, where N is the total number of species, as well as the total mass balance are written and solved for the species mass fractions and the domain dimensions respectively. In the following, the species are indicated with the subscripts 1 (water), 2 (theophylline), 3 (HPMC) and 4 (Surelease). The domain at which the variable is referring to is indicated with a superscript letter. The model parameters, discussed in the following, are presented in Table 1.
Table 1.
Model parameters
| Independent parameters | Value | Description | |
|---|---|---|---|
|
|
2.2 × 10⁻⁹ (m2·s−1) (Caccavo et al., 2015) | Water diffusivity in the dissolved drug layer (ΩB) | |
|
|
1.5 × 10⁻¹⁰ (m2·s−1) (Caccavo et al., 2015) | Drug diffusivity in the dissolved drug layer (ΩB) | |
|
|
1.99 × 10⁻¹² (m2·s−1) (from experiment) | Water diffusivity in the polymeric film (ΩC) | |
|
|
3.1 × 10⁻¹³ (m2·s−1) (from experiment) | Drug diffusivity in the polymeric film (ΩC) | |
|
|
3 × 10⁻⁹ (m2·s−1) (Holz et al., 2000) | Water diffusivity in the dissolution medium (ΩD) | |
|
|
8.21 × 10⁻¹⁰ (m2·s−1) (Grassi et al., 2001) | Drug diffusivity in the dissolution medium (ΩD) | |
|
|
0.0115 (−) (Serajuddin and Jarowski, 1985) | Theophylline saturation mass fraction in water | |
|
|
4.95 (−) (from experiment) | Water equilibrium constant: relates the water mass fraction in ΩC to its equilibrium counterpart in ΩB | |
|
|
0.2 (−) (from experiment) | Water equilibrium constant: relates the water mass fraction in ΩDto its equilibrium counterpart in ΩC | |
| ρ10 | 1000 (kg·m−3) (Caccavo et al., 2015) | Pure water density | |
| ρ20 | 1200 (kg·m−3) (Caccavo et al., 2015) | Pure theophylline density | |
| ρ30 | 1200 (kg·m−3) (Caccavo et al., 2015) | Pure HPMC density | |
| ρ40 | 1200 (kg·m−3) | Pure Surelease density |
| Dependent parameters | Expression | Description | ||
|---|---|---|---|---|
| kdiss |
|
Theophylline dissolution rate constant | ||
|
|
|
Overall water mass transport coefficient between ΩB and ΩC | ||
|
|
|
Overall Theophylline mass transport coefficient between ΩB and ΩC | ||
|
|
|
Water mass transport coefficient between ΩB | ||
|
|
|
Theophylline mass transport coefficient between ΩB | ||
|
|
|
Overall water mass transport coefficient between ΩC and ΩD | ||
|
|
|
Overall Theophylline mass transport coefficient between ΩC and ΩD | ||
|
|
|
Water mass transport coefficient between ΩC | ||
|
|
|
Theophylline mass transport coefficient between ΩC | ||
|
|
|
Water mass transport coefficient between ΩD | ||
|
|
|
Theophylline mass transport coefficient between ΩD |
Domain ΩA
The domain ΩA represents the solid theophylline/HPMC layer. In this domain, the mass fraction of drug and polymer are constant and equal to the initial value: and . Since the mass fractions are fixed, the domain density (ρA) is constant, and the mass balance on a species is sufficient to describe the system deformation (RA(t)). The mass balance on the dissolving drug can be written using the Noyes and Whitney (1897) equation:
| (1) |
| (2) |
where kdiss is the dissolution rate constant, which describes the mass transfer rate from the solid layer into the liquid layer. Following Marucci et al. (2013), the dissolution rate can be estimated from the Sherwood correlation for a sphere by Sh = 2 + 0.6Re1/2Sc1/3 (Bird et al., 2007) considering that the product Re1/2Sc1/3 is very small due to the internal stagnant conditions (Manca and Rovaglio, 2003). Therefore, Sh = 2, and thus, . The parameter is the theophylline diffusivity in the domain ΩB, which is a water rich solution with a low percentage of HPMC and theophylline, a situation analogous to the fully swollen matrix of Caccavo et al. (2015), from which the value of the was taken [1.5 × 10⁻¹⁰ (m2·s−1)]. The mass fraction represents the theophylline saturation mass fraction at the solid–liquid interface (calculated from the solubility in water at 37°C: 11.6 g.L‐1 (Serajuddin and Jarowski, 1985)).
Domain ΩB
The domain ΩB represents the internal liquid layer made of a water solution of HPMC and theophylline. In this layer, the drug enters from ΩA (due to the solid layer dissolution) and leaves diffusing toward ΩC (first and second term at right hand side of eq. (3)). The HPMC, eq. (4), can only enter into this domain following the dissolution of the theophylline, but cannot be released (the diffusivity of the HPMC in the Surelease layer goes to zero). Water can enter into this region from the polymer coating, eq. (6), and the total mass of the system and its density vary according to eqs (5) and (7) respectively.
| (3) |
| (4) |
| (5) |
| (6) |
| (7) |
The transport parameter is the overall time‐dependent theophylline mass transport coefficient between ΩB and ΩC, defined in Table 1, which is a function of the theophylline diffusivities in both the domains: (from Caccavo et al. (2015)) and (from the experimental results). Similarly, is the overall water mass transport coefficient between ΩB and ΩC, defined in Table 1, which is a time‐dependent function related to the parameters (from Caccavo et al. (2015)), (from the experimental results) and to the equilibrium constant . The equilibrium constant relates the water mass fraction in ΩC to its equilibrium counterpart in ΩB: . Knowing that from the Surelease free film swelling tests and considering that , results in that (being and then ). This will allow the entry of water in the domain ΩB until its mass fraction reaches 99%, which is the equilibrium value. The domain ΩB at time zero, physically nonexistent, is mathematically represented by a very thin layer [3 × 10⁻⁹ (μm)] made of pure water, for numerical reasons, to avoid singularities.
Domain ΩC
This domain represents the polymer coating through which theophylline and water can diffuse. In particular, the theophylline diffuses from the inner layer, the liquid layer ΩB, and leaves the domain diffusing toward ΩD (first and second term at right hand side of eq. (8)). The Surelease in this case does not enter or leave the system; therefore, its mass is constant, eq. (9), but its mass fraction is not constant. Water can enter or leave this domain from both the dissolution medium (ΩD) and the liquid layer (ΩB), eq. (11). The total mass of the system and its density vary according to eqs (10) and (12) respectively.
| (8) |
| (9) |
| (10) |
| (11) |
| (12) |
Likewise , the transport parameter is the overall theophylline mass transport coefficient between ΩC and ΩD, defined in Table 1, which is a time‐dependent function related to the parameters and , this last being the diffusion coefficient of the theophylline in water at 37°C [8.21 × 10⁻¹⁰ (m2·s−1) (Grassi et al., 2001)]. is the overall water mass transport coefficient between ΩC and ΩD, defined in Table 1, which is a time‐dependent function related to the parameters , and . is the self‐diffusion coefficient of water in water at 37°C [3 × 10⁻⁹ (m2·s−1) (Holz et al., 2000)]. The equilibrium constant relates the water mass fraction in ΩD to its equilibrium counterpart in ΩC: . Knowing, from the Surelease free film swelling tests, that and considering that results in .
Domain ΩD
The domain ΩD represents the dissolution medium. Theophylline can reach this domain by diffusing through the polymer coating, eq. (13). The total mass of this domain, eq. (14), can vary due to the exit of water, described by eq. (15), and drug entering.
| (13) |
| (14) |
| (15) |
| (16) |
Despite the mass variation of the dissolution medium being negligible in normal dissolution tests where ΩD ≫ (ΩA+ΩB + ΩC), this might not be negligible in single pellet release tests.
Ensemble of pellets modelling
Homogeneous system
When modelling the drug release from an ensemble of pellets, the first conceivable approach is to consider the whole dose made of perfectly equal pellets (monodispersed system). This assumption requires a minimum variation of the equations presented in the Single pellet modelling section; in particular, the mass balances in the domain ΩD, eqs (13) and (14), become:
| (17) |
| (18) |
where NP represents the number of pellets in the system.
Heterogeneous system: relevance of the PSD of Cellets
The PSD of Cellets was implemented by considering the radius of the Cellets as a vector (R0) whose components were the average dimensions of each class. The drug layer thickness (RA0 ≈ RB0) was obtained by assuming a homogeneous drug distribution within all the particle classes, generating the same drug layer thickness (calculated in 6.3 μm). The external radii were calculated by assuming that all the sprayed Surelease homogeneously covered the pellets.
| (19) |
| (20) |
| (21) |
| (22) |
The ratio ni/ntot represents the numerical fraction distribution of the Cellets that also becomes, with the assumptions made, the numerical fraction distribution of the pellets.
In this case, the ODEs given by eqs (1), (3), (4), (5), (8), (9) and (10) have to be solved for each of the six classes, whereas the mass balance in the dissolution medium (ΩD), eqs (13), (14) and (15), become:
| (23) |
| (24) |
| (25) |
where Ni is the number of pellets in the ith class. Therefore, the system to solve is made of 6 × 7 + 2 = 44 ODEs.
Heterogeneous system: relevance of the SD of the coating thickness
Unlike the drug layer thickness, where the average thickness dimension can be estimated from the effective drug loading and the SD is too small to play a crucial rule, the SD of the polymeric coating thickness can have a great influence on drug release. This layer indeed is the limiting step, and it finely moderates the drug transport preventing a burst release. Its thickness, along with its resistance to the species transport, is strongly related to the drug mass flux. Thicker coatings reduce the mass fraction gradient and, hence, the drug mass flux. In contrast, thinner coatings increase the mass fraction gradient and thus the drug mass flux. There is a thickness distribution along a single pellet as well as between pellets, that could be observed from microscopic images.
In the present study, it has been supposed that this intra‐ and inter‐particles film thickness (ft) distribution can be described using a Gaussian distribution, eq. (26), in which μ and σ represent the mean and the standard deviation of the distribution (the approach is not constrained to this type of distribution; other distribution functions could be implemented to describe the real case). The cumulative distribution function is known, eq. (27), and dividing the interval (0–3 μ) in 10 classes with the same amplitude, it is possible to obtain the numerical fraction of particles in the ith class, eq. (28), of interval [ ] characterized by the film thickness , eq. (29). At this point, similarly to the previous case, the radii can be expressed by vectors (of 10 components) where the ith class will be different only for the film thickness, eqs (30)–(32).
| (26) |
| (27) |
| (28) |
| (29) |
| (30) |
| (31) |
| (32) |
The model thus formulated is a system of 72 ordinary differential equations (ODEs).
Model numerical solution
The model consists of a system of ordinary differential equations (ODEs) that was numerically solved in MATLAB R2014B, with the ode15s solver (Shampine and Reichelt, 1997). The initial conditions for the single pellet model are reported in Table 2, whereas the modification of these conditions for the ensemble of pellets model can be found within the text (Ensemble of pellets modelling section). The MATLAB code is available as Supporting Information.
Table 2.
Single pellet model variables with the respective ODE eq. number and the initial value of the variable
| Variable | ODE | Initial value | |
|---|---|---|---|
| RA | 1 | 306–3 × 10⁻⁹ (μm) | |
| RB | 5 | 306 (μm) | |
| RC | 10 | 326* or 336* or 366* (μm) | |
|
|
3 | 0 | |
|
|
4 | 0 | |
|
|
8 | 0 | |
|
|
9 | 1 | |
|
|
13 | 0 | |
| ΩD | 14 | 1 (L) |
The radii with the asterisks are theoretical values. It is assumed that all the Surelease sprayed goes onto the pellets
Results
Experimental results
Drug release from ensembles of pellets
The experimental results showing the drug release of the ensembles of pellets are presented in Figure 2.
Figure 2.
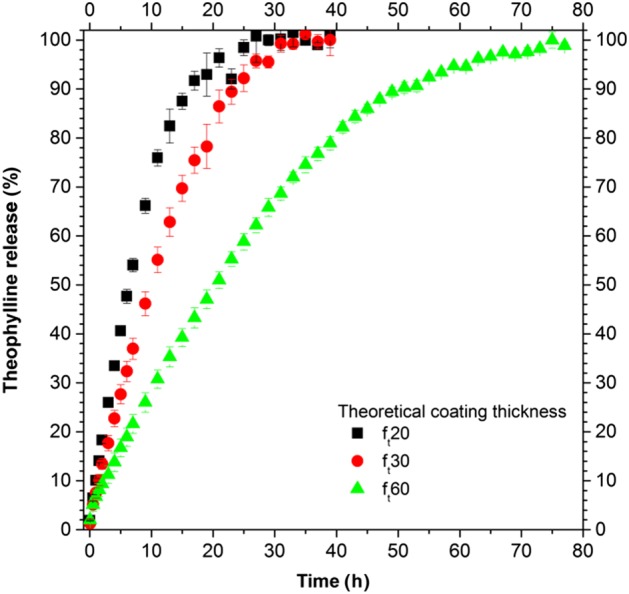
Experimental drug release from ensembles of pellets (500 mg) for three different theoretical coating thicknesses.
The release curves (Figure 2) show a constant release rate (zero‐order release) for up to 80% of the drug released, followed by a substantial decrease in the release rate. An increase in the polymeric film thickness decreased the drug release rate.
Surelease film properties
Diffusivity of water and theophylline in the Surelease film
The water and theophylline diffusion coefficients in the Surelease film were of 1.99 × 10⁻¹² ± 0.14 × 10⁻¹² and 3.1 × 10⁻¹³ ± 0.32 × 10⁻¹³ (m2·s−1) respectively. These values were used in the model to describe the diffusion of water and drug in the Surelease coating layer (ΩC), indicated with and in Table 1.
Swelling of the Surelease film
The recorded increase in the weight in the Surelease free film immersed in distilled water was around 20% w .w‐1 at equilibrium conditions.
PSD of Cellets
The cumulative mass distribution is presented in Figure 3, calculated by starting from the mass distribution. The results, in accordance with the Cellets producer, show a quite narrow PSD, with the majority of the particles having diameters between 500 and 750 μm. The numerical fraction was used to evaluate the effect of the PSD of the Cellets on the drug release behaviour.
Figure 3.
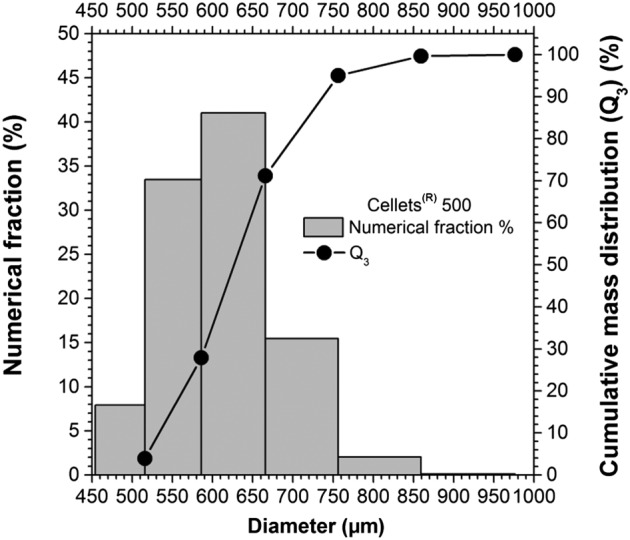
Particle size distribution (PSD) of Cellets 500 in terms of cumulative mass distribution and numerical fraction.
Polymer and drug layer thickness
Both the methods of preparation and analysis, described in the Polymer and drug thickness layers section, to evaluate the thickness of the polymeric layer were able to display an intra‐ and inter‐particle (i.e. between different particles and within the layer covering the same particle) inhomogeneity. This implies the presence of a thickness distribution along a single pellet and between pellets. (Figure 4)
Figure 4.
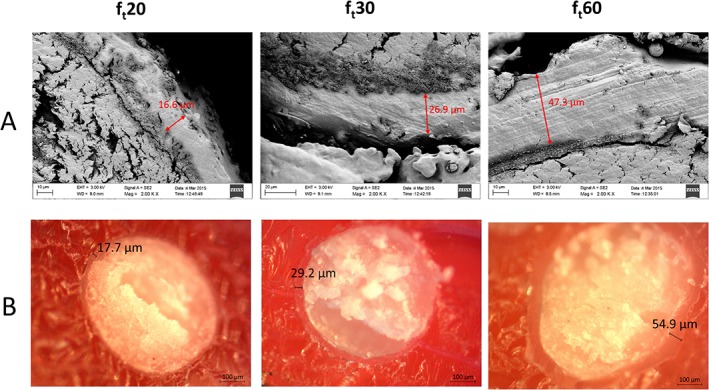
Polymeric layer thickness inhomogeneity. (A) Scanning electron microscope images of pellets cross sections. (B) Optical microscope images of pellet cross sections. Images on the left, centre and right depict pellets with a theoretical film thickness of 20, 30 and 60 μm respectively.
The drug layer thickness was estimated by considering the effective drug mass loaded onto the pellets, which was calculated from the release tests. It was assumed that the ratio of theophylline : HPMC (90:10 w .w‐1) was constant, when the thickness was calculated for Cellets of the same dimensions (single pellet case, Single pellet modelling section) or for PSDs of Cellets (Ensemble of pellets modelling section). In the latter case, in which the PSDs of Cellets was considered, it was assumed that the thickness of the drug layer was uniform within the PSD classes.
Single pellet model results
The systems of nine ODEs with the initial conditions (ICs) reported in Table 2 were simultaneously solved. The IC for the drug layer radius (RA0) was calculated from the effective drug mass loaded on the pellets, obtained from the drug release tests. IC for the coating layers RC0 was calculated by assuming a uniform covering efficiency of 100%. In the following, the radii and the drug mass fraction evolution, which are our main interest, within the system will be shown. However, with this modelling approach, the time evolution of all the other mass fractions as well as the single species mass evolution can be obtained.
The single pellet radii evolutions for a polymer coating thickness of 20 μm (ft20) are shown in Figure 5. The radius of the solid layer RA linearly decreases with time until complete dissolution, at the critical time tc. The liquid layer radius RB increases mainly due to the water entering. The external pellet radius RC promptly absorbs water and swells; after that, its size increases due to the increase in the internal liquid layer. This leads to the stretching of the polymeric coating, with a reduction in its thickness (RC − RB decreases).
Figure 5.
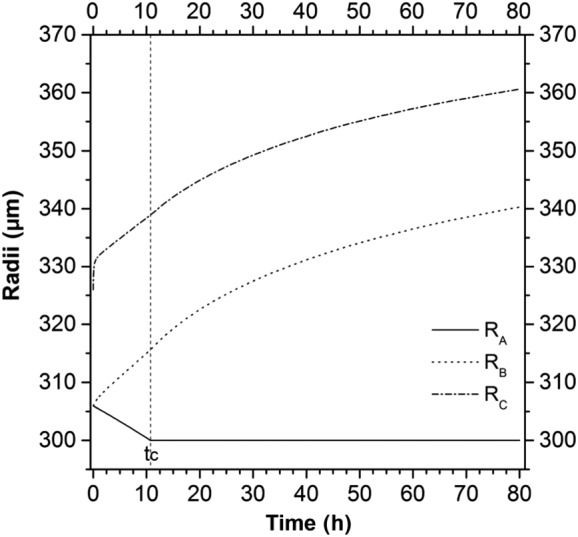
The development of an increased radii during the dissolution process for an initial polymer coating thickness of 20 μm.
The drug mass fraction evolutions in the domains ΩB , ΩC and ΩD during the dissolution process are presented in Figure 6.
Figure 6.
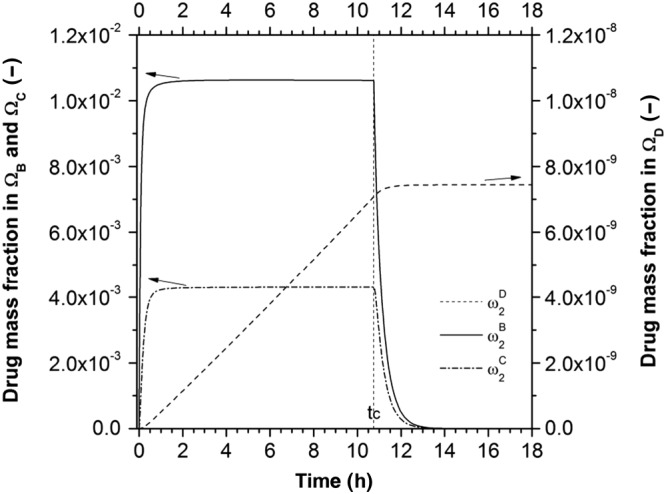
The changes in drug mass fraction in the various domains during the dissolution process for an initial polymer coating thickness of 20 μm.
Within the first hour, the drug mass fraction in the liquid layer ( ) reaches saturation conditions and stays at that value, thanks to the solid layer dissolution, until the critical time tc. At that point, the solid drug reservoir is finished and the mass fraction starts to decrease. The drug mass fraction in the polymeric coating ( ) follows the same trend of , reaching a constant value that is a function of the ease of drug transport within the system. The drug mass fraction in ΩD increases until reaching a constant value that represents the total initial amount of drug in one pellet in 1 L of dissolution medium.
Ensemble of pellets model results
Homogeneous system
This model, constituted by eqs (1)–(12) and (16)–(18), was first adjusted to reproduce the experimental results of the pellets with theoretical polymer thickness of 20 μm (ft20). The drug diffusion in ΩC was used as the only fitting parameter, and it was increased by a factor 2 to optimize the description of the experimental results. This modified model was applied to the systems with pellets of different coating thickness (Figure 7).
Figure 7.
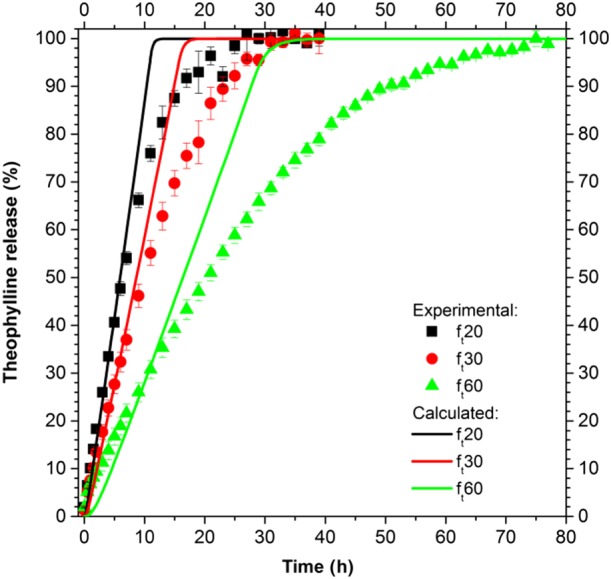
Drug release from ensembles of homogeneous pellets.
The drug release calculated shows a zero‐order behaviour for all the types of pellets and during all the dissolution process. Despite the prediction being good in the first hours, the model is not able to properly describe the experimental results when the drug release rate decreases.
Heterogeneous system
Relevance of the PSD of Cellets
The model utilized in this section is constituted by eqs (1)–(12), (16) and (19)–(25). Each class of pellets presents its fractional drug release that contributes to the average release (i.e. the characteristic release of the dose or, in other terms, the release that would be experimentally recorded). In Figure 8, the results in terms of release from the single class (individuated by eq. (19)) as well as in terms of average release from the different polymeric layers are shown. The model parameters were kept the same as in the homogeneous system model.
Figure 8.
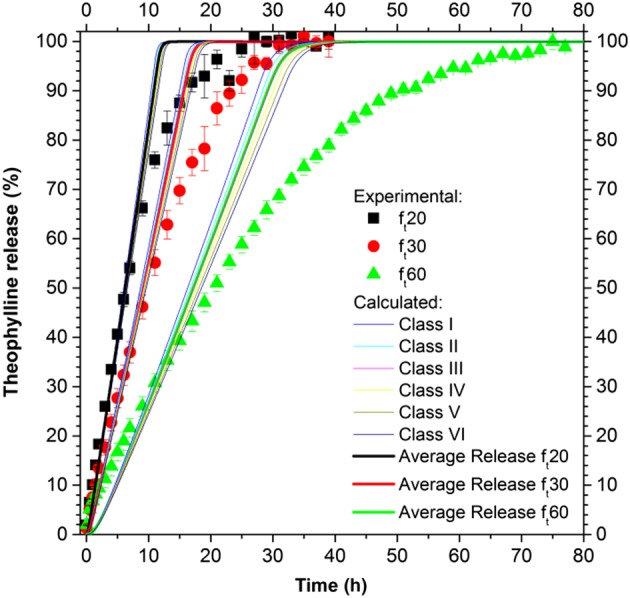
Drug release from ensembles of pellets, where the inert core has a PSD described for the six classes defined by eq. (20).
The drug release from the different classes is minimal, generating an average drug release similar to that of the homogeneous system.
Relevance of the SD of the coating thickness
The model, based on eqs (1)–(12), (16) and (23)–(32), was modified based on the experimental drug release of the pellets with theoretical film thickness of 30 μm (ft30) (R2 = 0.995). The transport parameters used were based on those found in the literature or experimentally (Table 1), using as fitting parameters the mean and the standard deviation of the film thickness distribution, μ and σ. The best fitting parameters were μfitting = 20 μm and σfitting = 7.5 μm. The SD of the film thickness is presented in Table 3. The most populated classes, in terms of numerical fraction , are between the second and the sixth classes. The drug release from the ith class, as well as the average release, are shown in Figure 9.
Table 3.
Film thickness distribution
|
|
|
|
||||||||||
|---|---|---|---|---|---|---|---|---|---|---|---|---|
|
|
|
|
||||||||||
| Class |
|
|
|
|
||||||||
| I | 1.95 | 3.00 | 6.00 | 2.71 | ||||||||
| II | 5.85 | 9.00 | 18.00 | 11.20 | ||||||||
| III | 9.75 | 15.00 | 30.00 | 25.18 | ||||||||
| IV | 13.65 | 21.00 | 42.00 | 30.82 | ||||||||
| V | 17.55 | 27.00 | 54.00 | 20.57 | ||||||||
| VI | 21.45 | 33.00 | 66.00 | 7.48 | ||||||||
| VII | 25.35 | 39.00 | 78.00 | 1.48 | ||||||||
| VIII | 29.25 | 45.00 | 90.00 | 0.16 | ||||||||
| IX | 33.15 | 51.00 | 102.00 | 0.01 | ||||||||
| X | 37.05 | 57.00 | 114.00 | 0 |
Figure 9.
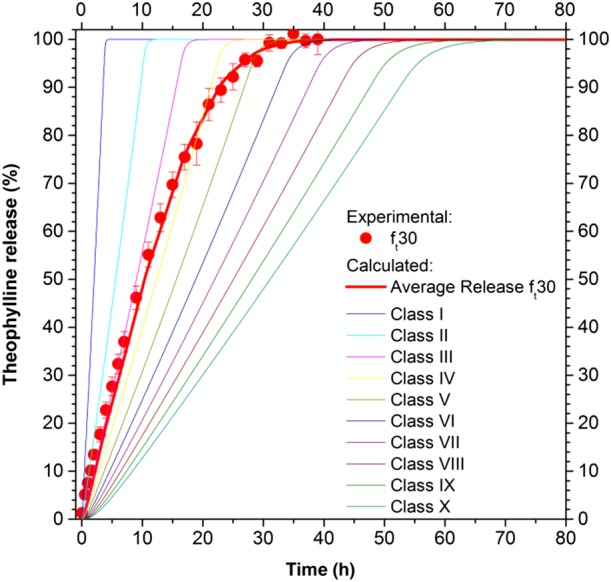
Drug release from an ensemble of pellets with different film thickness distributions.
This modelling approach does not require adjustable transport parameters, which were obtained from literature or experiments (Table 1), and requires two parameters for the description of the SD of the film thickness. These last two were successfully related to the initial theoretical film thickness, by considering the results obtained for ft30, as follows:
| (33) |
In this way, a fully predictive model was obtained and tested on the other two systems: ft20 and ft60, whose film thickness distribution is reported in Table 3. The modelling results, in terms of average release, are presented in Figure 10 and compared with the experimental data. The agreement is very good for ft20 (R2 = 0.991) and satisfactorily good for ft60 (R2 = 0.981), confirming that the distribution of the film thickness is a crucial component in the understanding and modelling of drug release from pellets.
Figure 10.
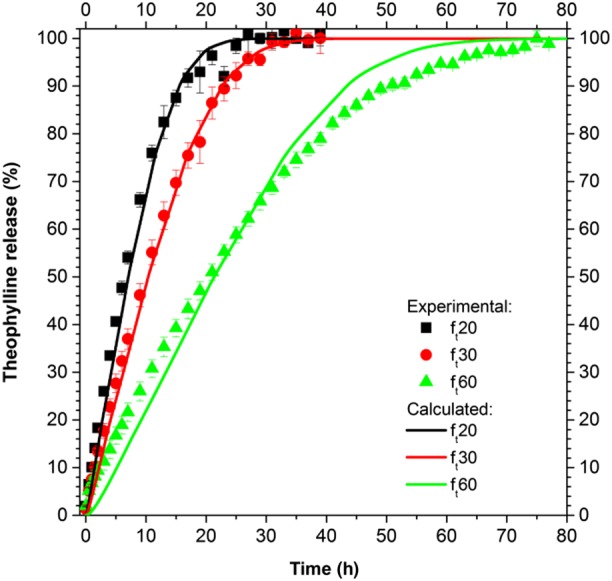
Drug release from ensembles of pellets with various SD of the film thickness and predictive modelling results for ft20 and ft60.
Discussion and conclusions
In this work, a mathematical model for predicting drug release from an ensemble of coated pellets was proposed, implemented and successfully compared with experimental results. A layered lumped parameters modelling approach was used to describe the single‐coated pellet behaviour in terms of size and species mass fraction time evolutions. The pellet was assumed to consist of several time‐dependent domains representing the inert core, the solid and liquid drug layers and the polymeric film coating. The time evolution of the dimensions of the pellet (Figure 5) shows that the accumulation of water, driven by the concentration difference between the external medium and the internal liquid layer, generates a volumetric deformation of the system. In particular, water accumulates inside the pellet promoting the further dissolution of solid drug. This water uptake leads to an overall increase in the size of the pellet and to the stretching of the polymeric film layer, due to its limited swelling ability with respect to the inner part of the pellet. The analysis of the evolution of the drug mass fraction (Figure 6) within the pellet and in the external dissolution medium shows that the presence of water within the pellet helps to dissolve the solid drug up to its dissolution limit, a value that is kept constant until the complete dissolution of the solid drug reservoir. This clearly shows that, in this case, the drug dissolution is not a limiting step.
The single pellet model was successively extended to describe ensembles of pellets where different approaches to describe the system polydispersity were hypothesized and implemented. In particular, as the simplest approach, a perfectly homogeneous system of pellets was modelled, from which a drug release kinetic of zero order was obtained, far from the experimental results (Figure 7). To reproduce the experimental sigmoidal drug release results from ensembles of pellets, drug diffusion coefficients as a function of the dissolution time could be used (i.e. Marucci et al., 2013), based on the assumption that morphological changes in the polymeric film modify the diffusion process. However, from our results, which are supported by the morphological analyses pre‐ and post‐dissolution (results not shown) that show the absence of substantial modifications, this approach was rejected and the hypothesis of a perfectly homogeneous system was found to be too simplistic to be able to reproduce the experimental results.
A more realistic modelling approach is to consider the heterogeneity of the ensemble of pellets. This can arise from several factors: the particle SD of the inert core, drug or polymer layer thickness distribution and so forth. In particular, the impact of the PSD of Cellets and the relevance of the polymeric coating thickness distribution were evaluated. The effect of the drug layer thickness distribution was disregarded a priori, as the value calculated from the effective mass of drug loaded onto the pellets provided a good estimation of the drug layer thickness. This assumption is justified as we found that this layer is only few micrometres and its distribution around this mean value would not substantially affect the results. In modelling the inert core SD (Figure 8), six classes were used with a different inert core radius, reported in eq. (19). In modelling the film thickness SD (Figure 9 and Table 3), 10 classes were used, which differ in their film thickness dimensions (reported in Table 3).
From analysing the impact of the SD of Cellets (Figure 8), it is evident that the difference in drug release from the different classes is minimal (the pellets in these classes differ only in the size of their Cellets), and the average release does not differ from the drug release obtained when considering a homogenous system. This can be explained by assuming that the mass flow rate of the ith class ( ) is proportional to the inert core radius to the power of two, eq. (34). The drug release from the ith class Ri(t), from eq. (36), can be expressed as the product of the drug mass flow rate times the dissolution time t, divided by the initial drug mass in the ith class m20i, eq. (38). This latter value is proportional to the inert core radius to the power of two, eq. (37), similar to the mass flow rate, therefore giving a drug release independent of the inert core radius, eq. (38).
| (34) |
| (35) |
| (36) |
| (37) |
| (38) |
From this analysis, it is evident that the PSD of Cellets, under the hypotheses of homogeneous drug and polymer layers thickness within the classes, has a negligible impact on the pellets produced. However, inert cores with narrow PSD should always be preferred since they are easier to fluidize and can ensure a more homogeneous layering.
From the analysis of the impact of the SD of the polymeric film thickness on the drug release (Figure 9), it can be seen that the classes of pellets with a lower film thickness promptly release the theophylline, while the release rate decreases with an increase in film thickness. The resulting average release, which was obtained from the results of all the classes, is able to reproduce the experimental results that deviate from a zero‐order release behaviour. Similarly, Donbrow et al. (1988) using a simple statistical model (in which the distribution of up to three parameters was assumed and arbitrarily varied: payload, payload release time and release rate constant), theoretically demonstrated that the ensemble release rate, different from a kinetic of zero order, could be obtained from single pellets release of zero order, by considering the parameters of the distribution of the ensemble. In the present study, by using a mechanistic model and analysing the distribution of physical properties (inert core dimension and film thickness distribution), it has been demonstrated that some features (i.e the film thickness distribution) could have more impact than others (i.e. inert core radius) on the drug release behaviour.
The drug release from an ensemble of pellets with a theoretical film thickness of 30 μm (ft30) was initially described (Figure 9) by using only the film thickness dimension (average thickness and its standard deviation, assuming a Gaussian distribution) as a fitting parameter. The values of the fitting parameters resulting from the optimization procedure were successfully related to the theoretical film thickness, eq. (33), and demonstrated that the average thickness able to describe the drug release was lower than the theoretical thickness, as for the drug coating, confirming that the experimental efficiency of layering was lower than one. Moreover, the correlation with the theoretical thickness allowed us to obtain a predictive model capable of describing the drug release from other ensembles of pellets with a different theoretical film thickness (Figure 10), demonstrating that the right physical phenomena were considered and described.
In conclusion, in this work, a mechanistic model for the description of drug release from a single coated pellet as well as from a polydispersed ensemble of pellets was developed, implemented and successfully compared with experimental results. Both the models, the single pellet model and the ensemble of pellets model, could be successfully used to describe and predict the drug release from these systems. Moreover, the results of the ensemble of pellets model clearly demonstrated that the SD of the inert core has a minimal impact on the drug release, whereas the polymeric film thickness distribution plays the major role, indicating that it is a key parameter to control in the production of pellets‐based drug delivery systems.
Author contributions
D.C. contributed to establish the model, wrote the code and runs the simulations; M.M.C. performed the experiments and analysed the data; A.A.B. supervised the modelling work and organized the data; J.K. organized the experimental work; A.L. had the basic idea, organized the experiments and supervised the experimental work; G.L. contributed to establish the model and organized optimization strategies. All the authors contributed in the writing and in the editing of the manuscript.
Conflict of interest
The authors declare no conflicts of interest.
Declaration of transparency and scientific rigour
This Declaration acknowledges that this paper adheres to the principles for transparent reporting and scientific rigour of preclinical research recommended by funding agencies, publishers and other organisations engaged with supporting research.
Supporting information
Data S1 MATLAB code in PDF format.
Data S2 Whole dose of pellets (film thickness SD) ‐ MATLAB code in TXT format.
Data S3 Whole dose of pellets (cellets SD) ‐ MATLAB code in TXT format.
Data S4 Single pellet model ‐ MATLAB code in TXT format.
Caccavo, D. , Lamberti, G. , Cafaro, M. M. , Barba, A. A. , Kazlauske, J. , and Larsson, A. (2017) Mathematical modelling of the drug release from an ensemble of coated pellets. British Journal of Pharmacology, 174: 1797–1809. doi: 10.1111/bph.13776.
References
- Abrahamsson B, Alpsten M, Jonsson UE, Lundberg PJ, Sandberg A, Sundgren M et al. (1996). Gastro‐intestinal transit of a multiple‐unit formulation (metoprolol CR/ZOK) and a non‐disintegrating tablet with the emphasis on colon. Int J Pharm 140: 229–235. [Google Scholar]
- Bird RB, Stewart WE, Lightfoot EN (2007). Transport Phenomena. Wiley: USA. [Google Scholar]
- Borgquist P, Nevsten P, Nilsson B, Wallenberg LR, Axelsson A (2004). Simulation of the release from a multiparticulate system validated by single pellet and dose release experiments. J Control Release 97: 453–465. [DOI] [PubMed] [Google Scholar]
- Borgquist P, Zackrisson G, Nilsson B, Axelsson A (2002). Simulation and parametric study of a film‐coated controlled‐release pharmaceutical. J Control Release 80: 229–245. [DOI] [PubMed] [Google Scholar]
- Caccavo D, Cascone S, Lamberti G, Barba AA (2015). Controlled drug release from hydrogel‐based matrices: experiments and modeling. Int J Pharm 486: 144–152. [DOI] [PubMed] [Google Scholar]
- Dappert T, Thies C (1978). Statistical models for controlled release microcapsules: rationale and theory. J Membr Sci 4: 99–113. [Google Scholar]
- Donbrow M, Hoffman A, Benita S (1988). Variation of population release kinetics in polydisperse multiparticulate systems (microcapsules, microspheres, droplets, cells) with heterogeneity of one, two or three parameters in the population of individuals. J Pharm Pharmacol 40: 93–96. [DOI] [PubMed] [Google Scholar]
- Grassi M, Colombo I, Lapasin R (2000). Drug release from an ensemble of swellable crosslinked polymer particles. J Control Release 68: 97–113. [DOI] [PubMed] [Google Scholar]
- Grassi M, Colombo I, Lapasin R (2001). Experimental determination of the theophylline diffusion coefficient in swollen sodium‐alginate membranes. J Control Release 76: 93–105. [DOI] [PubMed] [Google Scholar]
- Grassi M, Grassi G, Lapasin R, Colombo I (2006). Understanding drug release and absorption mechanisms: a physical and mathematical approach. CRC Press: Boca Raton, FL, USA. [Google Scholar]
- Gross ST, Hoffman A, Donbrow M, Benita S (1986). Fundamentals of release mechanism interpretation in multiparticulate systems – the prediction of the commonly observed release equations from statistical population‐models for particle ensembles. Int J Pharm 29: 213–222. [Google Scholar]
- Holz M, Heil SR, Sacco A (2000). Temperature‐dependent self‐diffusion coefficients of water and six selected molecular liquids for calibration in accurate 1H NMR PFG measurements. Phys Chem Chem Phys 2: 4740–4742. [Google Scholar]
- Kaunisto E, Marucci M, Borgquist P, Axelsson A (2011). Mechanistic modelling of drug release from polymer‐coated and swelling and dissolving polymer matrix systems. Int J Pharm 418: 54–77. [DOI] [PubMed] [Google Scholar]
- Manca D, Rovaglio M (2003). Modeling the controlled release of microencapsulated drugs: theory and experimental validation. Chem Eng Sci 58: 1337–1351. [Google Scholar]
- Marucci M, Andersson H, Hjartstam J, Stevenson G, Baderstedt J, Stading M et al. (2013). New insights on how to adjust the release profile from coated pellets by varying the molecular weight of ethyl cellulose in the coating film. Int J Pharm 458: 218–223. [DOI] [PubMed] [Google Scholar]
- Noyes AA, Whitney WR (1897). The rate of solution of solid substances in their own solutions. J Am Chem Soc 19: 930–934. [Google Scholar]
- Serajuddin ATM, Jarowski CI (1985). Effect of diffusion layer pH and solubility on the dissolution rate of pharmaceutical acids and their sodium salts II: salicylic acid, theophylline, and benzoic acid. J Pharm Sci 74: 148–154. [DOI] [PubMed] [Google Scholar]
- Shampine LF, Reichelt MW (1997). The MATLAB ODE suite. Siam J Sci Comput 18: 1–22. [Google Scholar]
- Siepmann F, Siepmann J, Walther M, MacRae RJ, Bodmeier R (2008). Polymer blends for controlled release coatings. J Control Release 125: 1–15. [DOI] [PubMed] [Google Scholar]
Associated Data
This section collects any data citations, data availability statements, or supplementary materials included in this article.
Supplementary Materials
Data S1 MATLAB code in PDF format.
Data S2 Whole dose of pellets (film thickness SD) ‐ MATLAB code in TXT format.
Data S3 Whole dose of pellets (cellets SD) ‐ MATLAB code in TXT format.
Data S4 Single pellet model ‐ MATLAB code in TXT format.


