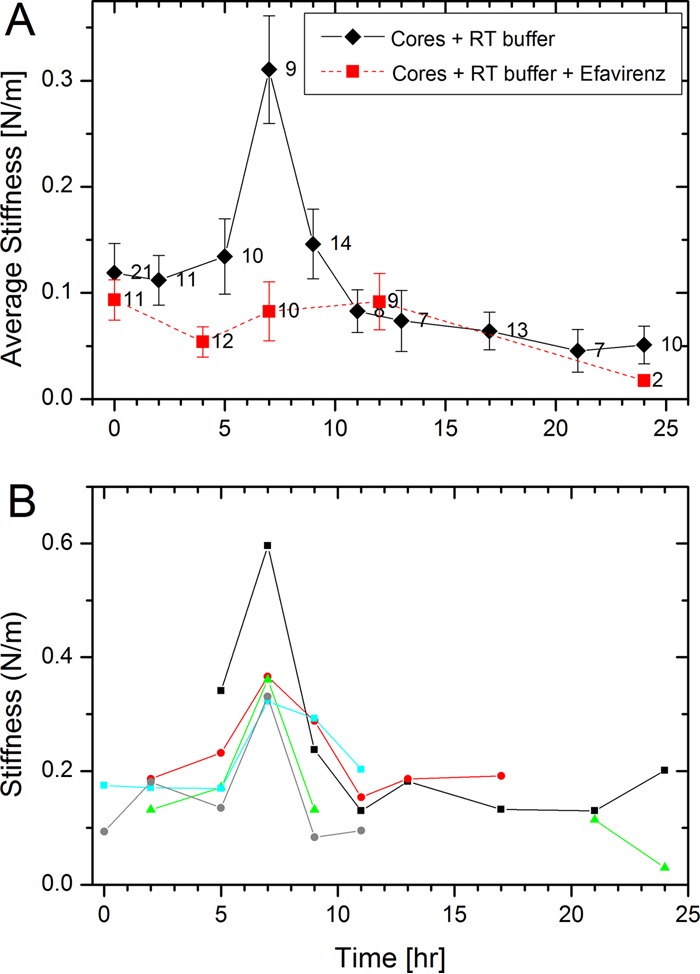
FIG 1.

Changes in the stiffness of HIV-1 cores during reverse transcription. Cores were adhered to HMDS-coated glass slides and kept in MOPS buffer. Reactions were initiated by adding dNTPs and MgCl2 to the cores, and their stiffness values were measured using AFM. The initial average stiffness value of cores prior to reverse transcription is represented as time zero. (A) The average stiffness values of cores in the absence or presence of the reverse transcription inhibitor efavirenz are plotted in black and red, respectively. The error bars represent the standard errors of the mean, and the number of cores analyzed is indicated beside each data point. (B) Stiffness trajectories of five individual isolated HIV-1 cores as a function of the progress of reverse transcription.
