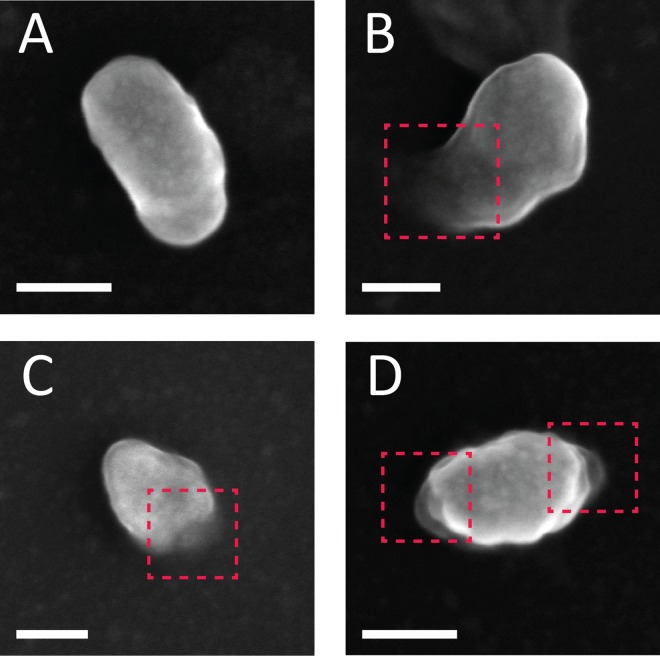
FIG 3.
SEM analysis of HIV-1 cores morphology during reverse transcription. (A) Intact core observed prior to reverse transcription. (B to D) Damaged cores exhibiting openings at the vicinity of capsid's narrow end visualized after 15 h of reverse transcription (total number of cores imaged was 88). A core with openings at both ends is shown in panel D. For clarity, openings in the cores are shown within dashed red rectangles. Scale bars, 50 nm.

