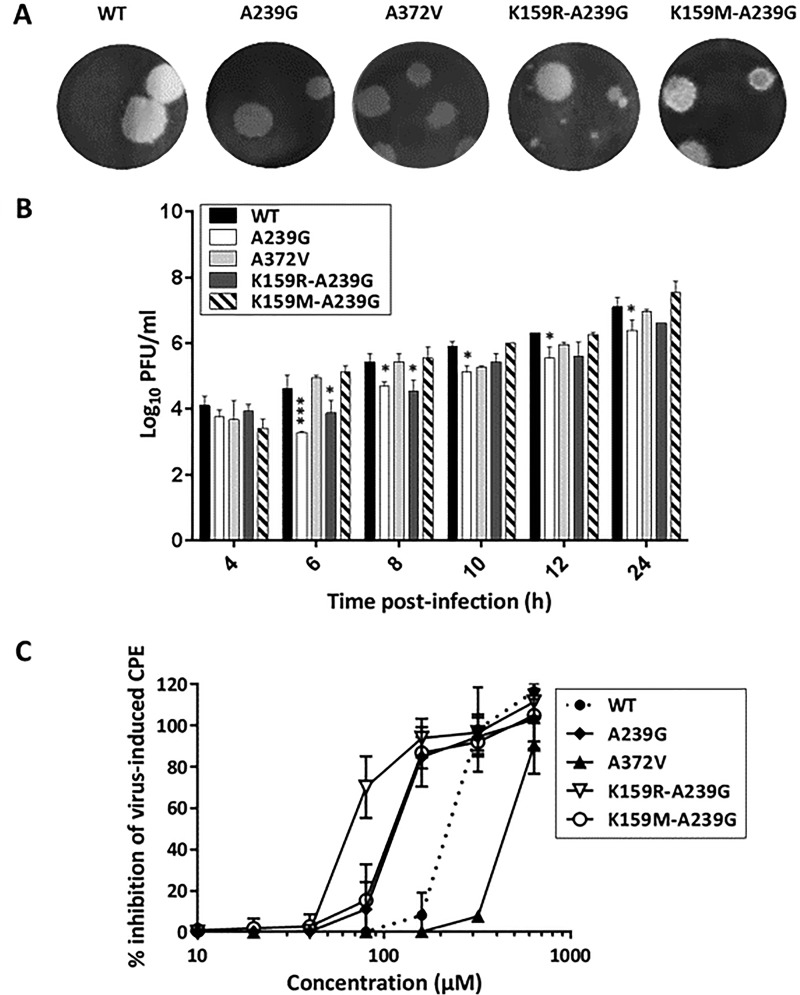
FIG 5.
Phenotype of reverse-engineered CVB3 variants. (A) Plaque phenotypes of different CVB3 variants were determined by infecting Vero A cells with a 10-fold serial dilution of each variant, followed by the addition of an agarose overlay. After 3 days, viral plaques were visualized by Giemsa staining. A representative image with spread plaques is shown. (B) Growth curves were generated by infecting Vero A cells with the selected CVB3 variant at an MOI of 3, after which the infectious virus titer in the medium was determined at various time points after infection by plaque assay. Infectious virus titers are the means ± SD of the results of two independent experiments. Significant differences with respect to the WT (*, P < 0.05, or ***, P < 0.001) were analyzed by two-way ANOVA. (C) The sensitivity of the reverse-engineered CVB3 variants to the antiviral effect of T-705 was assessed in HeLa Rh cells by a CPE reduction assay. Cell viability was measured using the MTS/PMS method. Data are expressed as percentages of untreated controls and are mean values ± SD of the results of at least three independent experiments.

