Fig. 9.

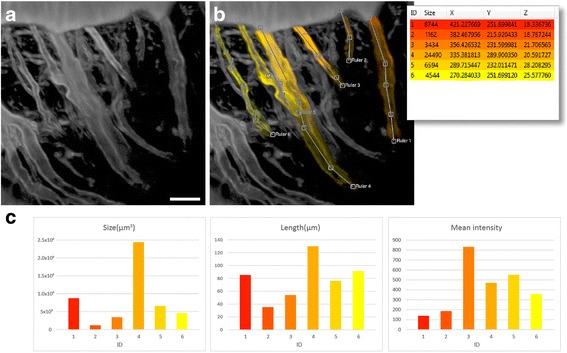
Analysis of six nerves from one channel of a confocal scan. The scan is an inner ear of the vestibular system (Opsanus tau). a Volume rendering of the scan. The nerves are different in size, length, and intensity. The scale bar represents 20 μm. b We select and define six SOIs, each representing a nerve. We also use a ruler tool to measure the length of each selection. The inset shows a list of the selected nerves, which are color-coded according to their IDs (1–6). c The selected nerves are differentiated and compared by performing a series of analysis functions, including calculations of volumetric size, length, and mean intensity. The results are shown in the charts. The intensity range of the scan is 0-4095 for a 12-bit microscopy file format
