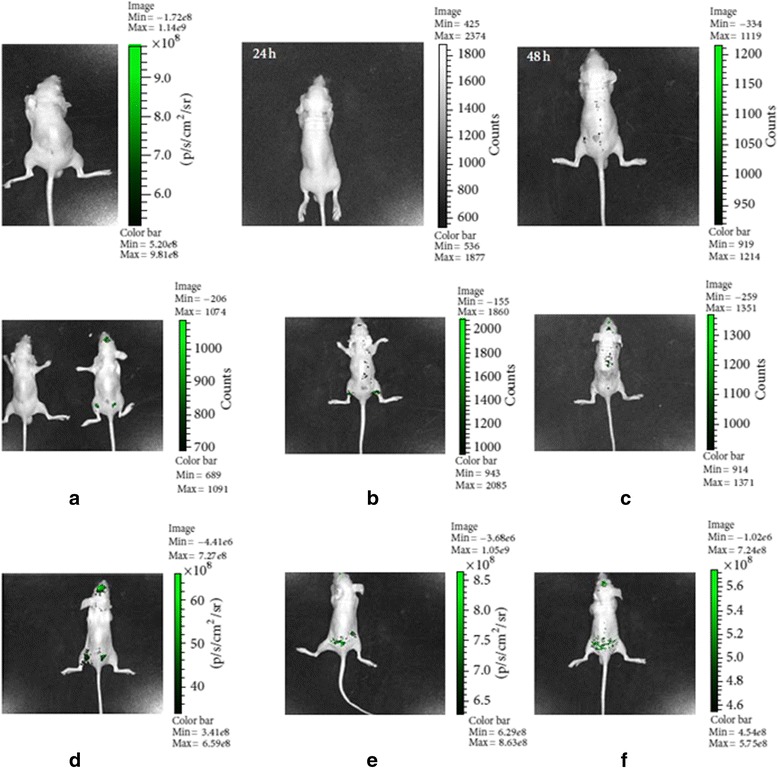
Fig. 6.

In vivo optical molecular imaging. d 0-h, (e) 24-h, and (f) 48-h images showing the distribution of target cells in the group of SPIONs-MSCs + MF. At 24 h (e) and 48 h (f), target cell distribution is clear; however, this is not observed in the SPIONs-MSCs group without the MF at the same time points for (b) and (c) respectively. The (a) showes the SPIONs-MSCs group without the MF at 0-h
