
Fig. 4.
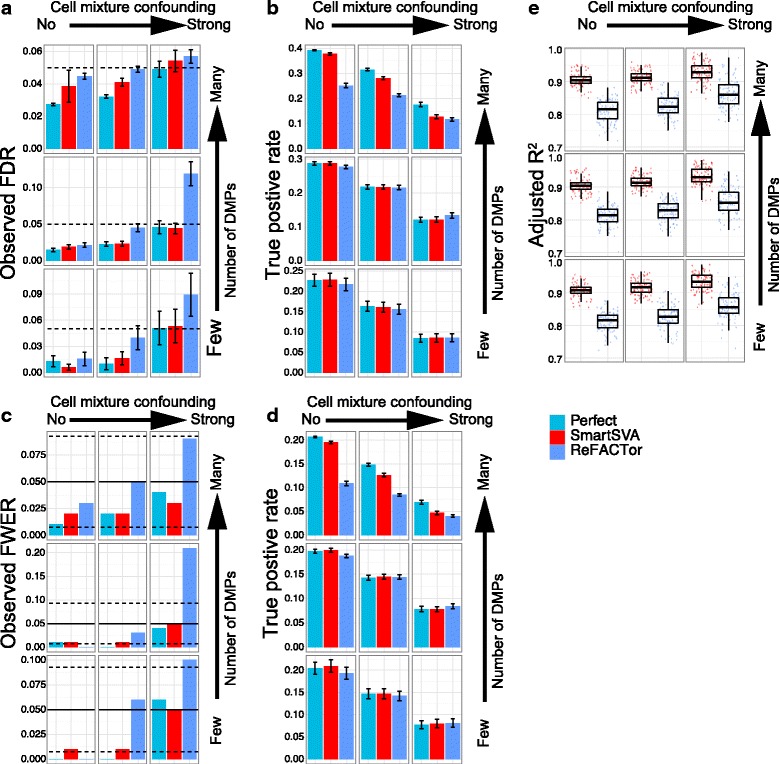
The performance of ReFACTor with site selection on the control samples. Nine scenarios were investigated with different levels of signal density (0.1%, 1% and 10%) and cell mixture confounding (no, moderate and strong). The “Perfect” method, which adjusts for real cell proportions and batch effects, is included to benchmark other methods. Performance was evaluated by (a-b) the observed false discovery rate (FDR) and true positive rate after FDR control (5% level, dashed line), (c-d) the observed family-wise error rate (FWER) and true positive rate after Bonferroni correction (5% level, solid line; 95% CI, dashed lines) and (e) the fraction of cell compositional variability (8 cell types jointly) explained by the components as quantified by adjusted R2. Error bars represent the standard errors. The SmartSVA is still more powerful than ReFACTor in dense signal scenarios and captures the cell composition better than ReFACTor. The type I error for ReFACTor is inflated in highly confounded scenarios, indicating less efficient site selection using half of the samples