Fig. 4.

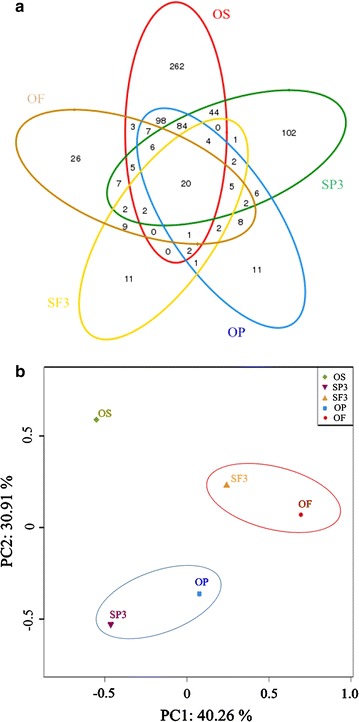
OTUs and the bacteria phylum distribution at the end of fermentation. a Venn diagram analysis of the OS, OP, OF, SP3, and SF3 experiment groups; b PCA of the OS, OP, OF, SP3, and SF3 experiment groups

OTUs and the bacteria phylum distribution at the end of fermentation. a Venn diagram analysis of the OS, OP, OF, SP3, and SF3 experiment groups; b PCA of the OS, OP, OF, SP3, and SF3 experiment groups