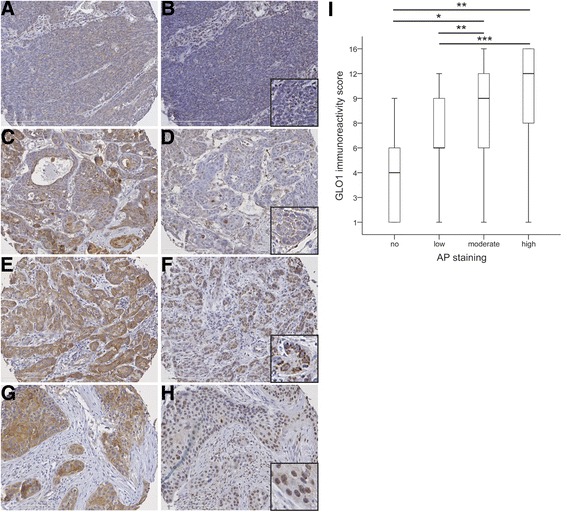
Fig. 1.

Detection of AP modifications and GLO1 protein expression in tumor cells of OPSCC. Representative pictures of an immunohistochemical staining with an anti-AP antibody (brown staining) demonstrate tumor sections with low (a), moderate (c) or high staining (e and g). Serial sections were analyzed with an anti-GLO1 antibody and revealed a heterogeneous staining pattern (brown signal) with low (b), moderate (d) and high immunoreactivity scores (f and h), considering staining intensity and relative amount of positive tumor cells. GLO1 staining was detected either in the cytoplasm (f) or the nucleus (h) of tumor cells. i Boxplot displays the median and 25% to 75% percentile of the GLO1 immunoreactivity score in subgroups of OPSCC patients (n = 134) with no, low, moderate or high AP staining. *p ≤ 0.05, **p ≤ 0.005 and ***p ≤ 0.0005. Counterstaining was done with hematoxylin to visualize tissue architecture; white bar indicates 200 μm
