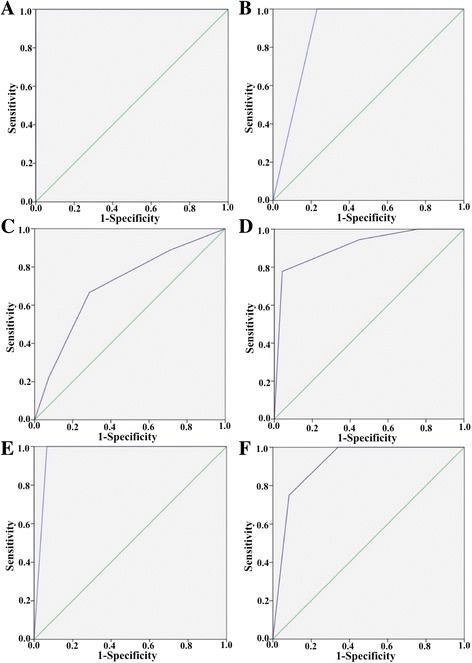
Fig. 3.

ROC curve analysis of the positive predictability of biopsy specimens. a 1 tumor-containing fragment. AUC = 1, P = 0.099. b 2 tumor-containing fragment. AUC = 0.885, P = 0.194. c 3 tumor-containing fragment. AUC = 0.705, P = 0.045. d 4 tumor-containing fragment. AUC = 0.909, P = 0.039. e 5 tumor-containing fragment. AUC = 0.978, P < 0.001. f 5 tumor-containing fragment. AUC = 0.915, P < 0.001
