
Fig. 5.
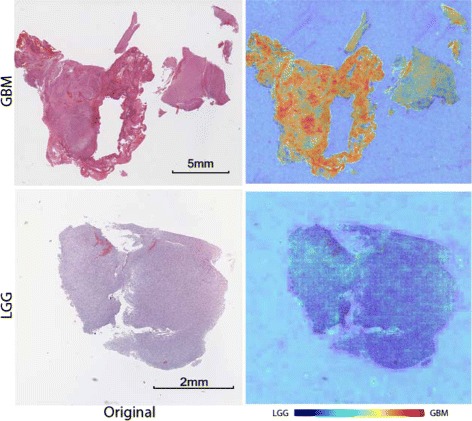
Heatmap for brain tumor GBM vs LGG classification. Each patch of the whole slide image is assigned a confidence using the classifier, which forms the heatmap. Regions that are red in color are more likely to be GBM regions. The purpose of these heatmaps is to illustrate which part of the whole slide image is considered important for the classifier and to prove the expressiveness of CNN features. In the GBM example, the endothelial proliferation regions, which are considered an essential morphologic cue for the diagnosis of GBM, show high positive confidence