Fig. 1.

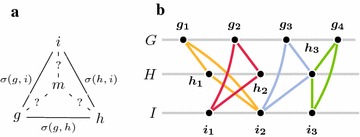
a Illustration of the score of a candidate median gene. b Gene similarity graph of three genomes G, H, and I. Colored components indicate candidate median genes , , , and . Median gene pairs and are conflicting

a Illustration of the score of a candidate median gene. b Gene similarity graph of three genomes G, H, and I. Colored components indicate candidate median genes , , , and . Median gene pairs and are conflicting