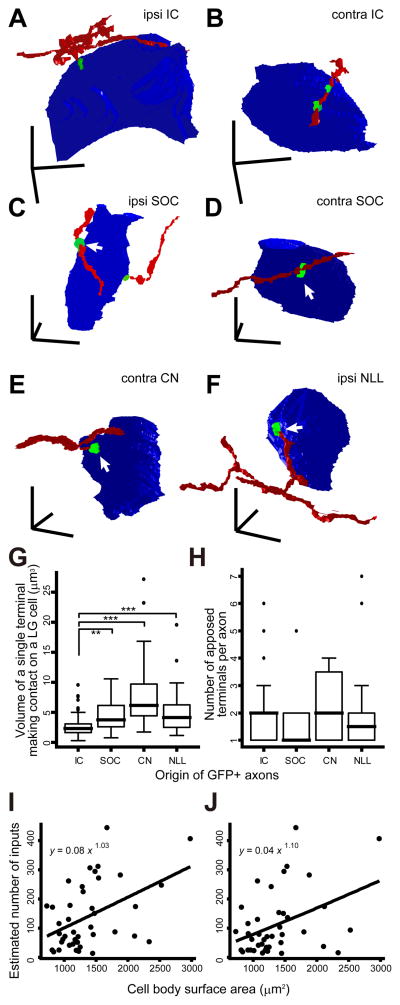
Figure 5.
Single axons made only a few axosomatic contacts on a single LG cell. (A–F) Three-dimensional reconstruction of GFP+ axons (red), GFP+/VGLUT2+ terminals (green), and LG neural cell bodies (blue). (A, B) LG cells and IC glutamatergic axons that terminate on the LG cell bodies, which are the reprint from Fig. 9B, C of Ito and Oliver (2014). (C) An LG cell shown in Fig. 3A, which was found in the ipsilateral side to the injected SOC. (D) An LG cell shown in Fig. 3B, which was found in the contralateral side to the injected SOC. (E) An LG cell shown in Fig. 4A, which was found in the contralateral side to the injected CN. (F) An LG cell shown in Fig. 4C, which was found in the ipsilateral side to the injected NLL. Arrows indicate the same terminals shown in Figs. 3 and 4. Note that terminals from lower nuclei (C–F) are larger than IC excitatory axosomatic terminals (A, B). Scale bars: 10 μm. (G, H) The volume of a single GFP+/VGLUT2+ terminal which made contact on a single LG cell body (G) and number of axosomatic contacts (H) by a single GFP+ axonal branch originated from the IC, SOC, CN, or INLL. Data of IC were from Ito and Oliver (2014). Thick horizontal bars indicate medians. Top and bottom horizontal hinges of boxes indicate 1st and 3rd quartiles, respectively. Circles are the outliers, and whiskers indicate the maximum and minimal values after eliminating outliers. The number of apposed terminals made by a single axon from the different sources was not significantly different (P = 0.53, Kruskal-Wallis multiple comparison test). On the other hand, volume of a single terminal that arose from IC neurons was significantly smaller than that from neurons in other nuclei. Asterisks indicate the pair showing significant difference (P < 0.05 for *, 0.05 < P < 0.01 for **, and 0.01 < P < 0.001 for ***, Kruskal-Wallis test). (I, J) The number of axosomatic inputs was almost proportional to the surface area of LG cell bodies. Estimated number of inputs, which was calculated by dividing total number of VGLUT2+ axosomatic terminals by number of GFP+/VGLUT2+ axosomatic terminals that arose from a single axon (I) or all axons (J) in a Z-stack. The fitting curves were calculated under a generalized linear model.

