Figure 6.
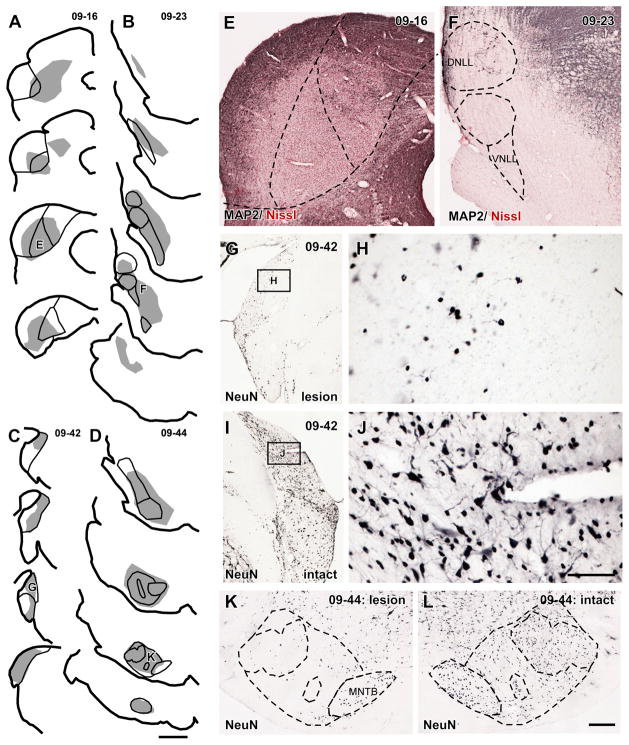
(A–D) Injection sites of kainic acid. Shaded area indicates sites with marked neuronal loss. (A) A case in which injection was made in the ICC (case 09-16). Neuronal loss was observed in the ICD and ICL as well. A trace with “E” is the same section as E. (B) A case in which injection was made in the INLL (case 09-23). Neuronal loss was observed in whole nuclei of the lateral lemniscus. A trace with “F” is the same section as F. (C) A case in which injection was made in the DCN (case 09-42). A trace with “G” is the same section as G. (D) A case in which injection was made in the SOC (case 09-44). Almost complete loss of neurons was obtained except for the MNTB. A trace with “K” is the same section as K. Each trace is separated by 480 μm. (E) A photomicrograph of the injection site of an IC injection case. MAP2+ neurons disappeared in the center of the IC. Counterstained with Neutral-Red. (F) A photomicrograph of the injection site of an INLL injection case. Almost complete loss of MAP2+ neurons in the nuclei of the lateral lemniscus. Counterstained with Neutral-Red. (G) A photomicrograph of the injection site of a DCN injection case. (H) A higher magnification of a box in G. Only small NeuN+ neurons, presumably granule cells, were found. (I) A photomicrograph of the intact side of the DCN of the same case of G. (J) A higher magnification of a box in I. Both large and small NeuN+ neurons were observed. (K) A photomicrograph of the injection site of a SOC injection case. Almost complete loss of NeuN+ neurons except for the MNTB. (L) A photomicrograph of the intact side of a SOC of the same case of K, showing normal cytoarchitecture of the complex. Scale bars: 1 mm (A–D), 300 μm (E, F, G, I, K, L), and 60 μm (H, J).

