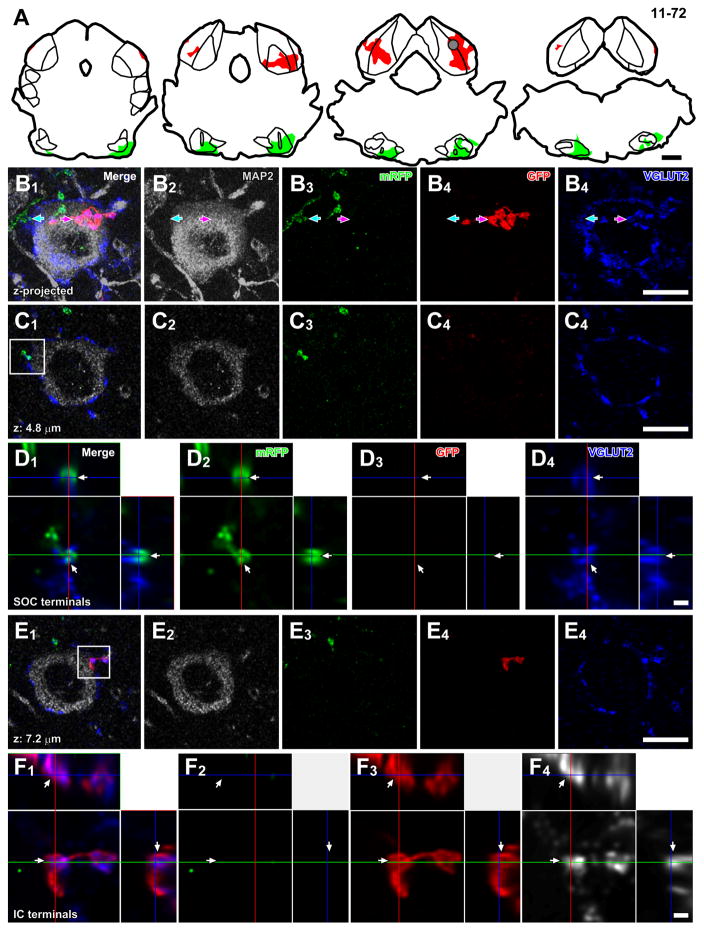
Figure 8.
Convergence of axons from lower brainstem nuclei and local neurons on a single LG cell. (A) Injection sites of palGFP Sindbis (red) and Sindbis pal-mRFP (green) viruses of case 11-72. Each trace was separated by 480 μm. A gray circle indicates approximate location of the LG cell in B–F. (B) Maximal projection of Z-stack images of a putative LG cell, which had MAP2+ cell body (gray) with dense VGLUT2+ axosomatic endings (blue), receiving axosomatic contact with both GFP+ (red arrows) and mRFP+ terminals (green arrows). The projection image was made from 23 Z-stack images, in which each image was separated by 0.48 μm. (C) A single Z-plane image showing axosomatic contact between mRFP+ terminals (green) and the LG cell body (gray). (D) A high-magnification image of a box in C1 with orthogonal views of the stack cut at 3 planes parallel to xy- (blue lines), yz- (a red line), and xz-planes (a green line). The terminal positive for both mRFP (green) and VGLUT2 (blue) was indicated by arrows. (E) A single Z-plane image showing axosomatic contact between GFP+ terminals (red) and the LG cell body (gray). (F) A high-magnification image of a box in E1 with orthogonal views of the stack. The terminal positive for both GFP (red) and VGLUT2 (blue) was indicated by arrows. Scale bars: 1 mm (A), 10 μm (B, C, E), and 1 μm (D, F).

