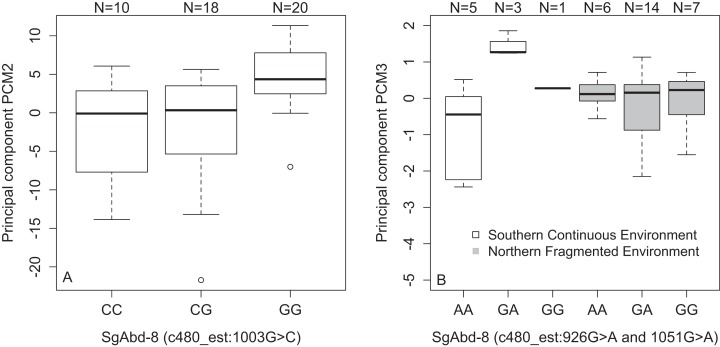
Figure 4. Variations in PCs-values of males of the different genotypes in three SNPs in the SgAbd-8 gene.
(A) PCM2 values per genotypes in the SNP c480_est:1003G>C. (B) Effect of environment on PCM3 values per genotypes in the SNPs c480_est:926G>A and c480_est:1051G>A. Individuals from southern continuous environment are shown in white, while individuals from northern continuous environment are shown in gray. Sample size is given by the number above the bar. Heavy horizontal lines represent median values, boxes give interquartile ranges, whiskers and dots give the minimum and maximum, and outlier values, respectively.

