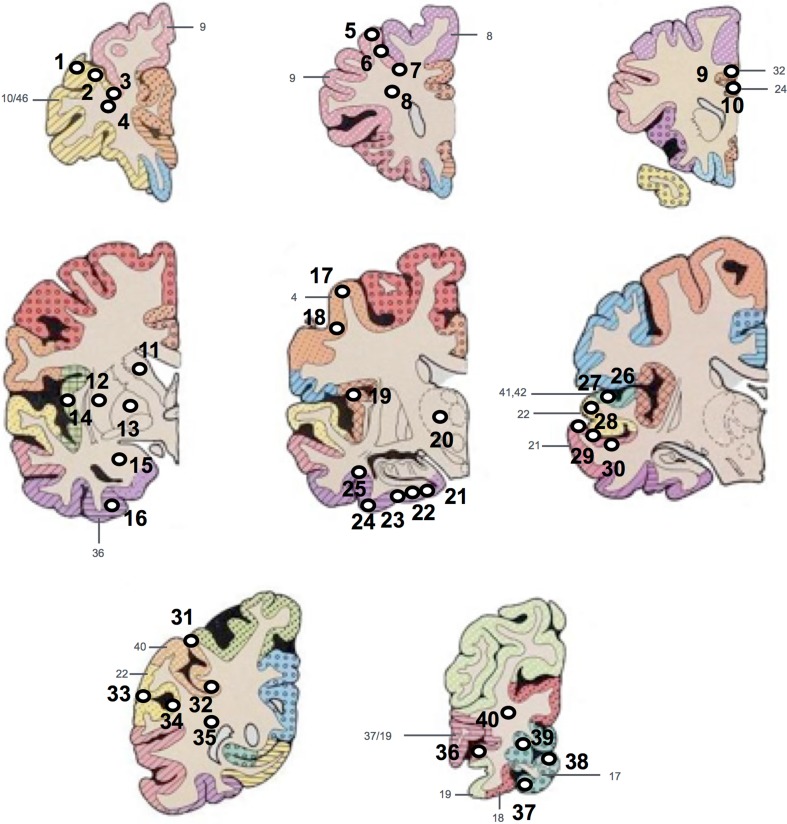
Fig. 1.
Diagram illustrating the locations where each of the tissue micro array (TMA) tissue cores were extracted from each diagnostic tissue block. Tissue cores 1–4 were taken from the pre-frontal cortex, 5–8 from mid-frontal cortex, 9 and 10 from the cingulate cortex, caudate, putamen, external globus pallidus, amygdala and insular cortex (11–16 + 19), 17 and 18 from motor cortex, thalamus (20), 21–25 from entorhinal cortex, 26–30 from temporal cortex, 31–35 from parietal cortex and 36–40 from occipital cortex. White circles and black numbers represent the tissue cores with numeric label. Gray numbers and color coding represent Brodmann areas
Adapted from (Perry and Oakley 1993)

