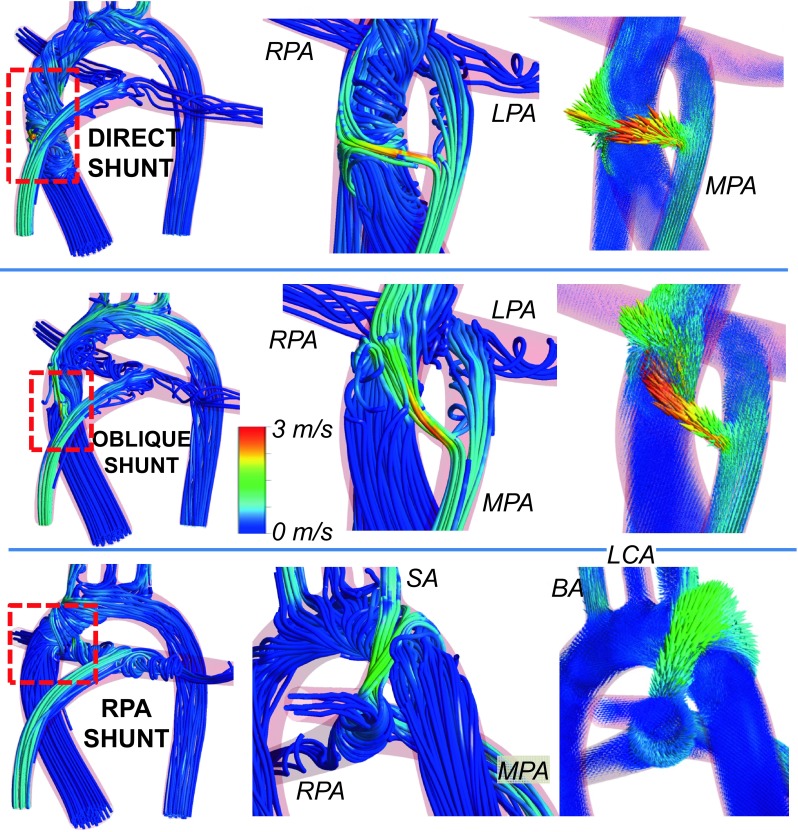
Figure 4.

Comparison of shunt configurations for the full model of tetralogy of Fallot (TOF) on aortic arch and pulmonary arteries. Figures on the left and at the middle show flow path lines colored with the velocity magnitude, while figures on the right show velocity vectors. The entire aortic region is displayed on the left, while the middle and right columns focused on shunt regions. Results are presented for the central direct, central oblique and RPA shunts from top to bottom, respectively. (MPA: Main pulmonary artery, RPA: Right pulmonary artery, LPA: Left pulmonary artery, BA: Brachiocephalic artery, LCA: Left carotid artery, SA: Subclavian artery.). Results are presented for high pulmonary vascular resistance (i.e., Q p/Q s is between 0.144 and 0.192).
