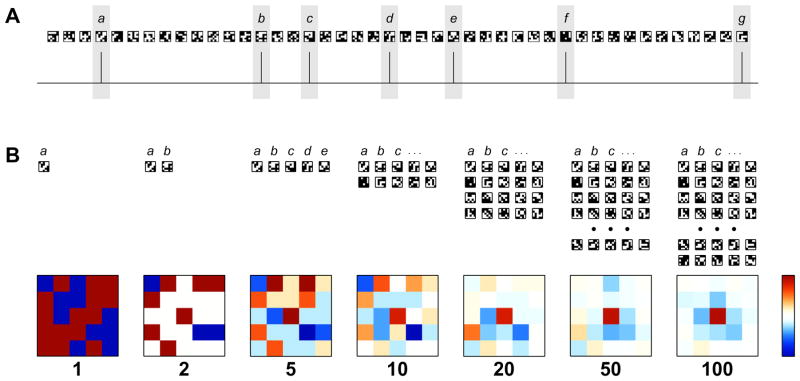
Fig. 4.
RF Extraction via Spike Triggered Averaging. The simplest methods to compute the RF from a recording use the Spike Triggered Averaging (STA) technique. This method and its variants rely upon the independence between signal and noise, and presume that at any given instance that the cell responds by firing a spike, there is some commonality among the stimuli presented that have elicited each spike. The commonality is interpreted as being descriptive of the linear portion of the RF, whereas non-commonalities in the stimuli will tend to average to zero for well-constructed stimuli. (A) A sequence of 5-by-5 checkerboards in temporal order along with an extracted spike train. Stimuli of practical use have many more squares than the reduced version shown here. Frames where a spike was detected are highlighted with a light gray box and labeled with lower case letters starting with a. (B) Labeled frames are collected, averaged, and normalized to form a map, shown here in snapshots with 1, 2, 5, etc. spikes detected to depict the evolution of the computation with an according number of checkerboards. Maps are shown on a scale where deep red represents response to white squares of the checkerboard, white indicates indifference to the stimulus, and deep blue represents response to black squares of the checkerboard. The map that is computed depicts the response of an on-center cell. Not shown is the extension of this technique to examine frames that immediately preceded each spike: the computation is run multiple times with differing temporal offsets between spike and selected frames, generating a movie of the optimal stimulus.

