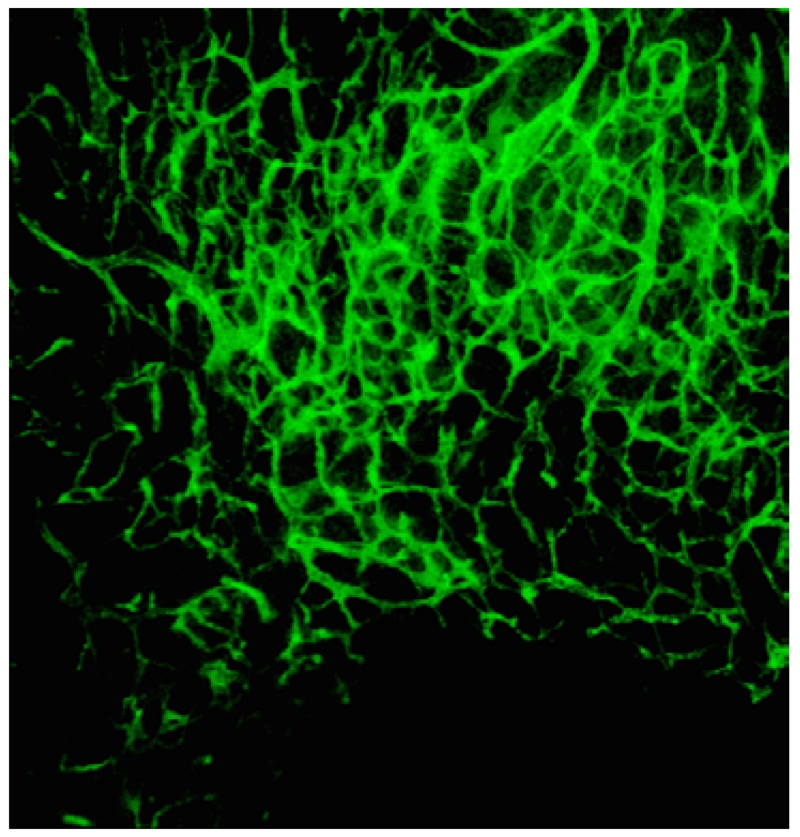
Figure 1.
In this maximum intensity projection of 3-D fluorescence microscopy image of murine cranial tissue, miscellaneous imaging artifacts are visible: uneven illumination (upper vs. lower parts), non-homogenous intensity distribution inside the vessels (visible in the larger vessels located at top right corner), low SNR regions (lower areas), high spatial density or closeness of vessels (majorly in the center-upper parts), reduced contrast at edges (visible as blurs mostly for the central vessels), broken or faint vessels (lower vessels), and low frequency background variations caused by scattered light (at higher density regions).

