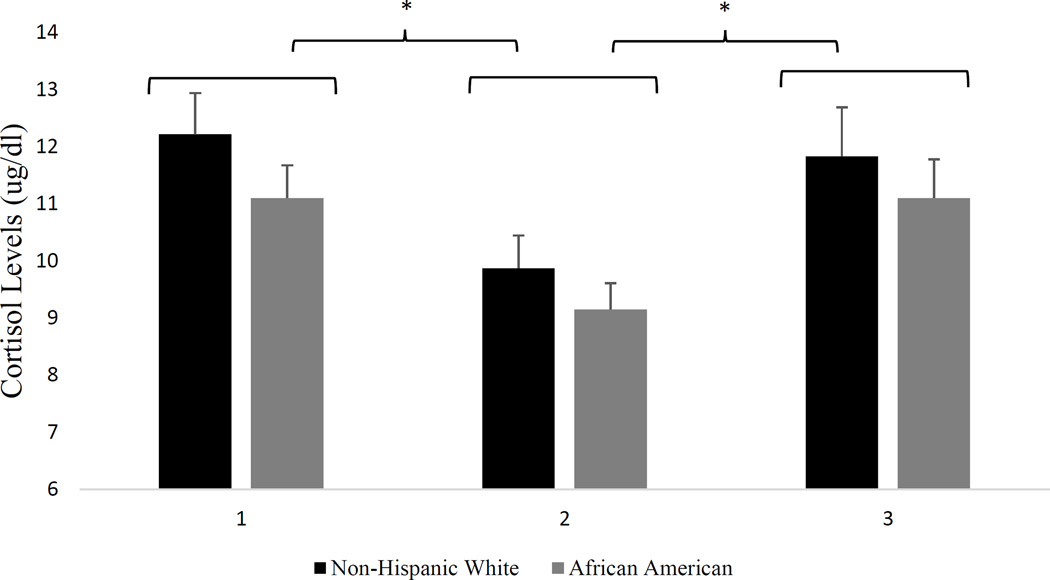
Figure 1.
Cortisol concentrations plotted separately by ethnicity.
* (P < 0.001). Cortisol concentrations at time 1 were significantly greater than cortisol concentrations at time 2; Cortisol concentrations at time 3 were significantly greater than cortisol concentrations at time 2
Note: 1 = baseline cortisol concentrations; 2 = cortisol concentrations obtained prior to the cold pressor task; 3 = cortisol concentrations obtained 20 minutes after the cold pressor task

