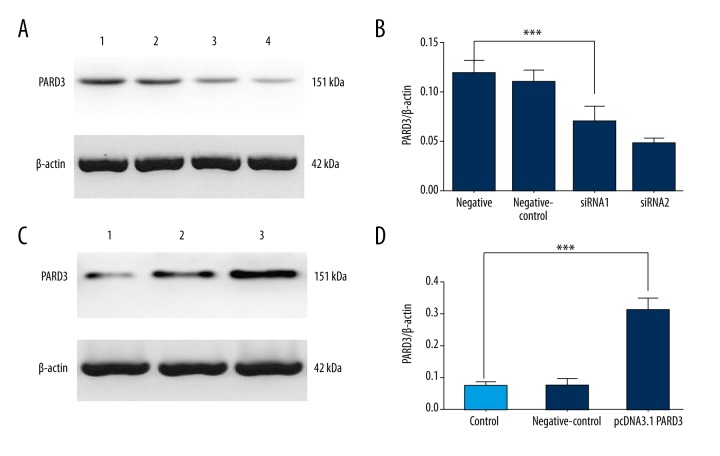
Figure 1.
Expression of PARD3 protein. (A) The expression level of PARD3 protein was assessed by Western blotting after PARD3-siRNA transfection for 72 h. 1 was normal control, 2 was negative control, and 3 and 4 were the knockdown group. (B) The relative expression of PARD3 is shown, normalized to β-actin. The difference between the PARD3 siRNA and normal control groups was statistically significant. (C) The expression level of PARD3 protein assessed by Western blotting after transfecting cells with pCDNA3.1-PARD3. 1 was normal control, 2 was negative control, and 3 was the overexpression group. (D) PARD3 protein expression was significantly higher in the Eca109 cells compared with control cells. * P<0.05; ** P<0.01; *** P<0.001.

