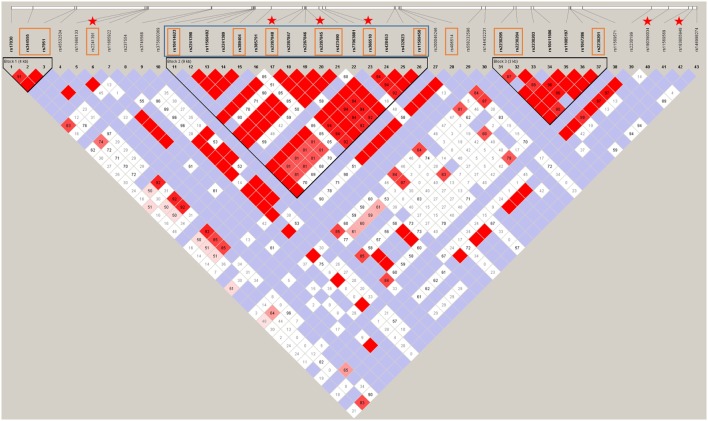
Figure 2.
The haploblock structure within C3 determined by Sanger sequencing and replication studies. The intensifying gradient of red represents the increasing relative linkage disequilibrium between two variants. The associating Block 2 is identified by the black triangle in the middle of the gene and had a multiallelic D' score of 0.623. The single nucleotide polymorphisms (SNPs) that were assessed in each replication stage are identified by the respective color square that correspond to colors in the material panel in Figure 1. The independently associating SNPs are indicated by stars. All SNPs in this image are listed in Table S4 in Supplementary Material.

