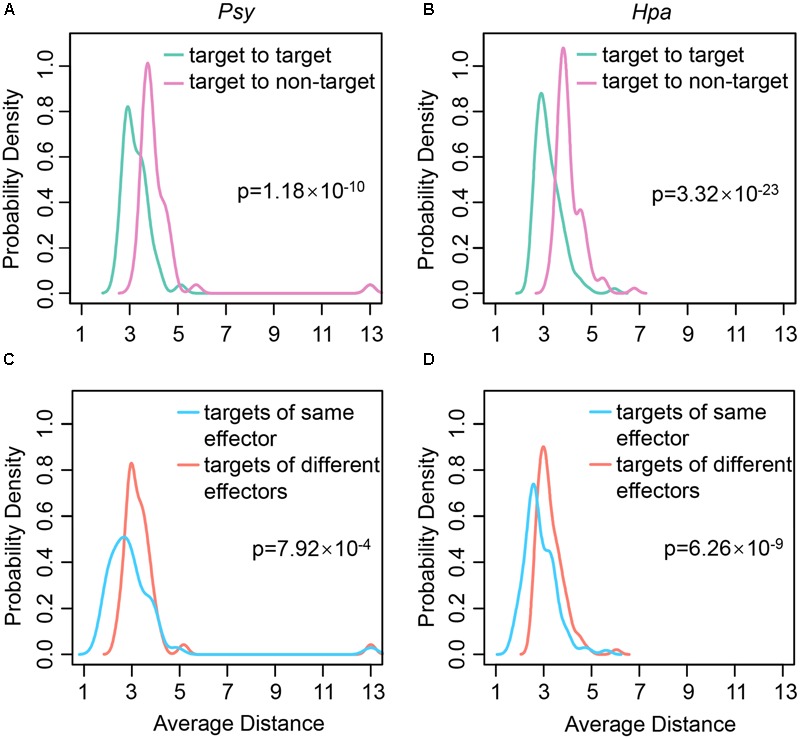
FIGURE 1.

The distributions of average distances between different types of proteins. The distributions of average distances (A) from each of Psy targets to the rest of Psy targets and to non-Psy targets; (B) from each of Hpa targets to the rest of Hpa targets and to non-Hpa targets; (C) from each of Psy targets to the effector targets interacting with the same Psy effectors and to those interacting with different Psy effectors; (D) from each of Hpa targets to the effector targets interacting with the same Hpa effectors and to those interacting with different Hpa effectors in the comprehensive Arabidopsis PPI network are plotted. The significance of the difference in distance distributions is estimated using one-tailed Wilcoxon’s test.
