
FIGURE 2.
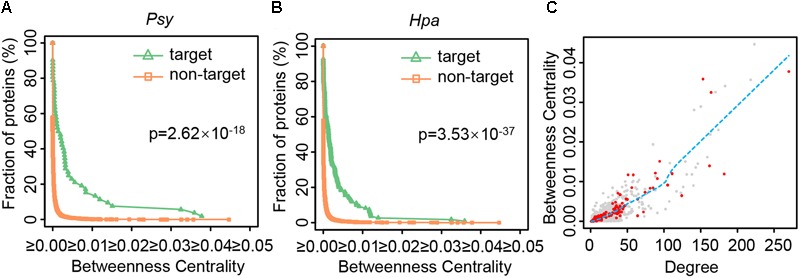
The distributions of betweenness centrality and degree for different types of proteins. (A,B) The cumulative distributions of the betweenness centrality of Psy targets, non-Psy targets, Hpa targets and non-Hpa targets in the comprehensive Arabidopsis PPI network are plotted after removing an outlier. The significance of the difference in betweenness centrality distributions is estimated using one-tailed Wilcoxon’s test. (C) The nodes represent all the proteins except for an outlier in the comprehensive Arabidopsis PPI network, of which red nodes represent both Psy targets and Hpa targets. The blue dashed line implies the tendency of betweenness centrality changing with degree, as estimated by the LOWESS smoothing method in R language.