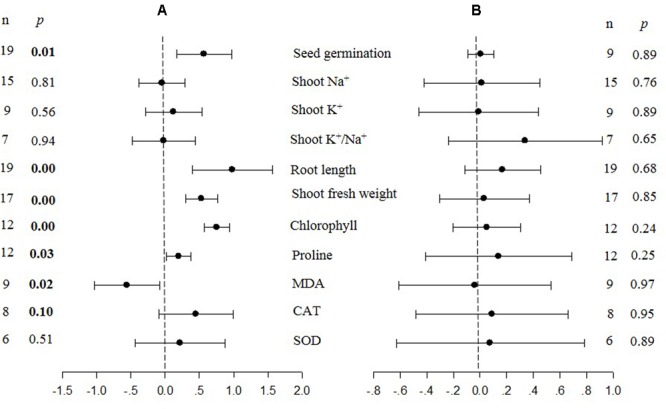
FIGURE 1.

Weighted summary effect sizes (ln R) and 95% confidence intervals (CIs) for the effect of CIPK overexpression in transgenic plants subjected to NaCl stress conditions (A) and non-stress conditions (B). A p ≤ 0.05 indicates that the moderator level was significantly different than zero; n stands for the number of studies.
