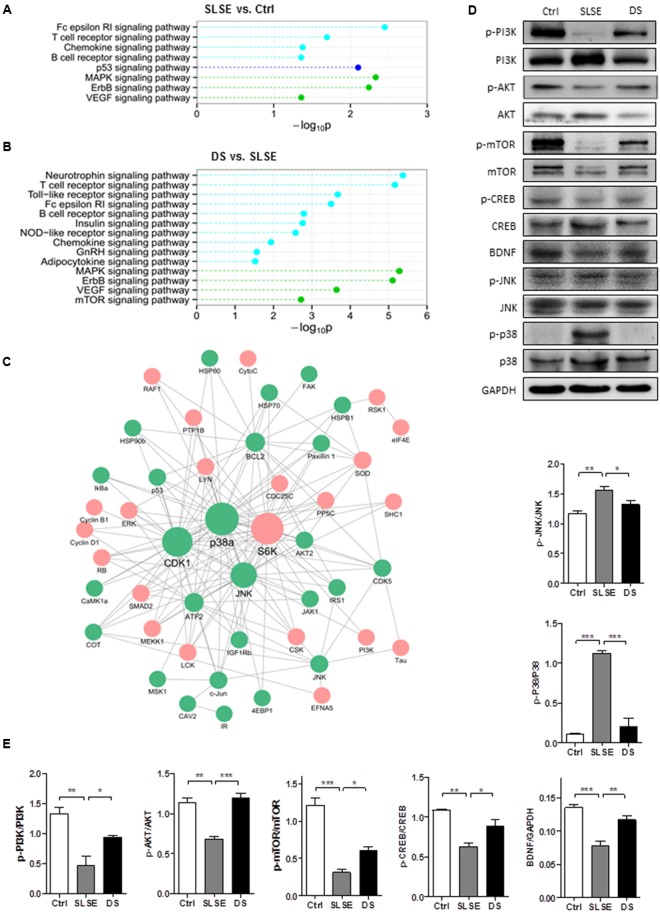
FIGURE 5.

Dammarane sapogenins affected the protein expression in the hippocampus of SLSE-exposed rats. KinexTM antibody microarrays were used to profile protein expression in the brains of SLSE, DS-treated, and control rats (n = 3 for each group). The altered signaling pathways were identified using KEGG enrichment analysis. Statistically significant value “p” was transformed to –log10P. The larger the “–log10P,” the more significant the difference is. Pathways within the same category are marked in the same color. Signaling pathways that differed between the Ctrl and SLSE groups in the hippocampus are shown in (A), and the signaling pathways that differed between the DS and SLSE groups are shown in (B). There were 51 differential expressed proteins whose trends in the Ctrl and DS groups compared with the SLSE group were consistent. By identifying the interologs, a hippocampus protein interaction network (C) was constructed with 165 interactions among 51 differentially expressed proteins. The proteins that were up-regulated by DS are marked with red circles, and those that were down-regulated by DS are marked with green circles. The proteins with more interactions with others were represented with larger circles. (D) Hippocampal tissue lysates were analyzed by western blotting with the indicated antibodies. (E) The corresponding statistical graphs of western blotting analyses. Data are expressed as means ± SEM. The differences were analyzed using one-way ANOVA with Bonferroni’s post hoc test (∗p < 0.05, ∗∗p < 0.01, ∗∗∗p < 0.001).
