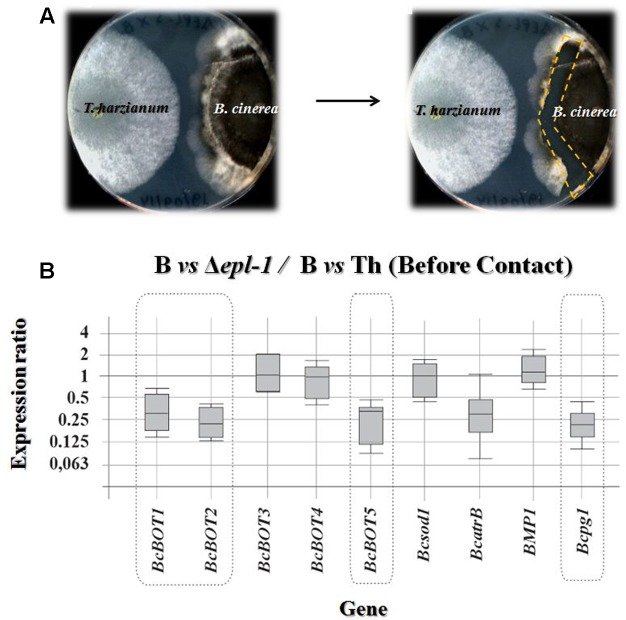
FIGURE 1.
(A) Photographs showing confrontation plate assays between T. harzianum and B. cinerea before hyphae contact. The right panel shows the region from which the B. cinerea mycelia was extracted (dashed line). (B) qPCR analysis of the relative expression level of several Botrytis virulence genes in mycelia confronted with T. harzianum Δepl-1 (Δepl-1) in comparison with the level of expression in mycelia of the pathogen (B) confronted with T. harzianum wild type (Th) strain, in both cases before hyphae contact. The expression ratios as well as the statistic probability values were calculated using the REST2009 software (Pfaffl et al., 2002). Expression ratio values statistically significant [P(H1) < 0.05] are outlined by a broken line. Numeric values are included in Supplementary Table S1a. Boxes represent the interquartile range, or the middle 50% of observations. The dotted line represents the median gene expression. Whiskers represent the minimum and maximum observations.

