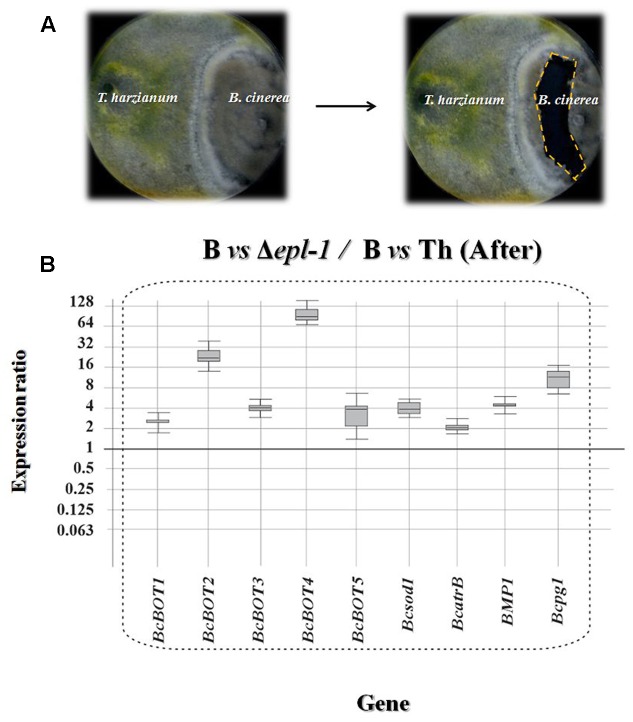
FIGURE 2.
(A) Photographs showing confrontation plate assays between T. harzianum and B. cinerea after hyphae contact. The right panel shows the region from which the B. cinerea mycelia was extracted (dashed line). (B) qPCR analysis of the relative expression level of several Botrytis virulence genes in mycelia confronted with T. harzianum Δepl-1 (Δepl-1) in comparison with the level of expression in mycelia of the pathogen (B) confronted with T. harzianum wild type (Th) strain after hyphae contact. Comparative calculations and graphic representations were carried out as indicated in the legend of Figure 1. Numeric values are included in Supplementary Table S1a.

