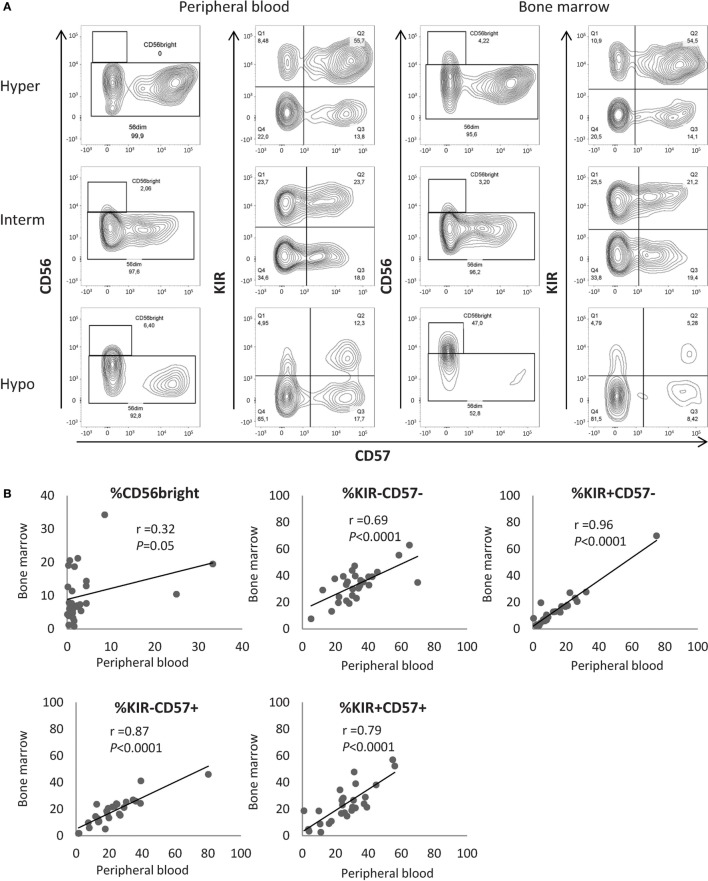
Figure 2.
Maturation profiles in the peripheral blood are representative of natural killer (NK) maturation profiles in the bone marrow (BM). (A) Examples of maturation profiles on appariated peripheral blood and BM samples by flow cytometry. (B) Correlation between the frequencies of NK cells in the different NK maturation clusters (Pearson correlation). Hyper, hypermaturation; Hypo, hypomaturation; Interm, intermediate maturation.

