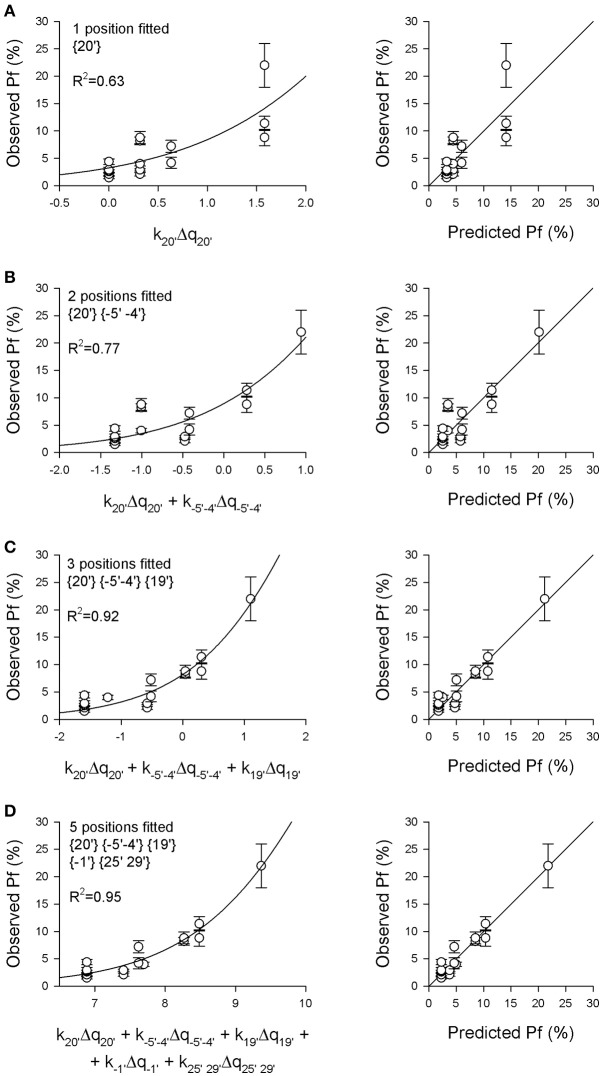
Figure 2.
The Pf-values of 16 different nAChRs are predicted by a model based on the charge distributions in five distinct pore regions. The experimentally measured Pf-values reported in Table 2 were plotted against the weighted sum of the electrical charges Δqi present in different pore regions, as indicated, with the multiplicative ki-values allowed to vary in order to best fit the data, according to Equation (see Section Methods for details). (A) Best fit of Pf-values (left) and comparison between observed and predicted Pf-values (right), using as independent variable only the electrical charge present in the extracellular position {20′}, representing the main determinant of Ca2+ permeability (const = 29.5, p = 0.0029; k20′ = −0.316, p = 0.0003). (B) The charge distributions in position {20′} and in the intracellular position {−5′ −4′} were used as independent variables (const = 10.2, p = 0.0501; k20′ = −0.321, p = 0.0001; k−5′−4′ = 0.266, p = 0.013). (C) The charge distributions in positions {20′}, {−5′ −4′} and {19′} were used as variables (const = 11.2, p = 0.0084; k20′ = −0.3806, p < 0.0001; k−5′−4′ = 0.3197, p = 0.0002; k19′ = −1.260, p = 0.0002). Note the substantial improvement of the fit adding the charges in position {19′} to the analysis, which now takes into account the negative glutamate residue present in α5 subunits in this position. (D) The electrical charges of the five indicated positions were used as variables (const = 41917, p = 0.82; k20′ = −0.5654, p = 0.0134; k−5′−4′ = 0.3521, p < 0.0001; k19′ = −0.0798, p = 0.90; k−1′ = −1,975, p = 0.0816; k25′ 29′ = 0.491, p = 0.1598). Note the high R2-value and the excellent agreement between observed and predicted Pf-values.

