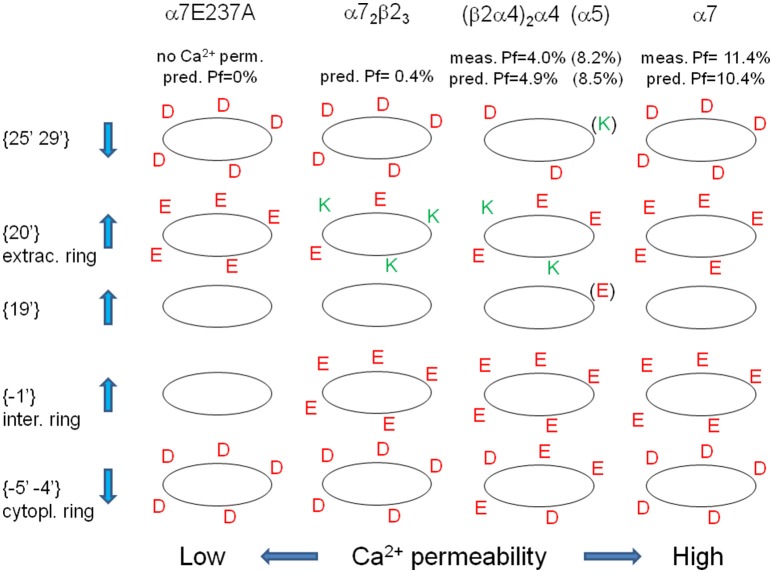
Figure 3.
Spatial distribution of charged amino acid residues in the proximity of the channel pore, for different nAChRs. For the indicated nAChRs the distribution of positive (green) and negative (red) amino acid residues is reported for each distinct TM2-flanking regions. Up- and down-wards arrows indicate rings in which higher negativity is associated with higher or lower Ca2+ permeability, respectively. In brackets the residues present if an α5 subunit replace an α4 subunit, yielding a strong increase in Ca2+ permeability. For each nAChR measured and predicted Pf-values are reported (in brackets for α5-contaning nAChRs).

