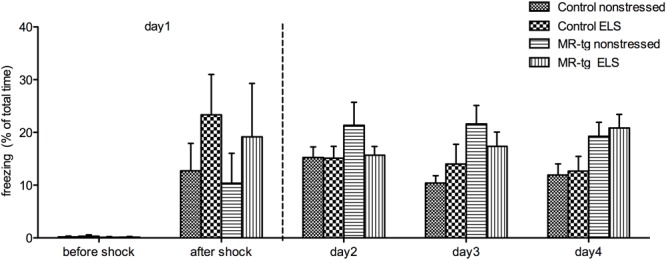
FIGURE 4.

Contextual fear conditioning in MR-tg and control mice. Bar graphs represent freezing time before the foot-shock (day 1), immediately after the foot-shock (day 1), and on day 2, day 3 and day 4. Data are expressed as mean ± SEM with p-values based on post hoc LSD. n = 8–11 mice per group.
