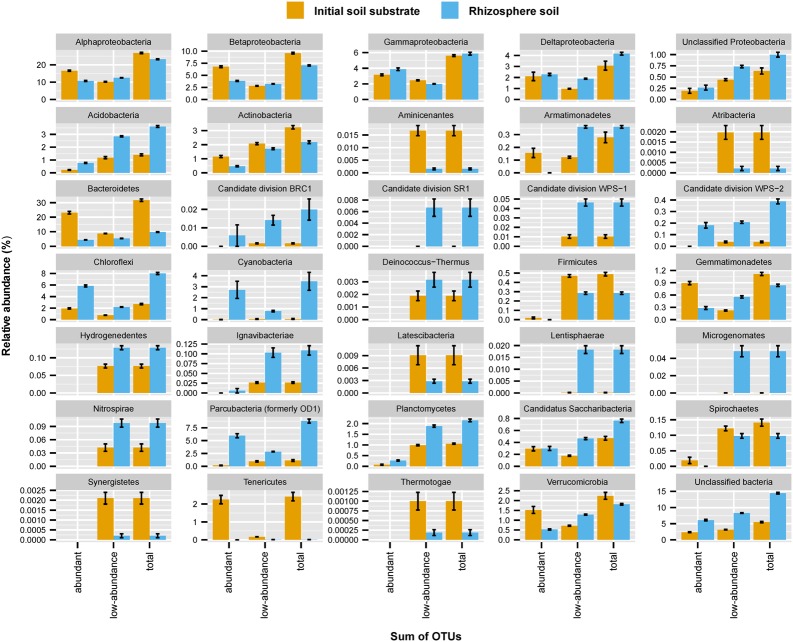
FIGURE 1.
Mean relative abundance of bacterial phyla or proteobacterial classes across the initial soil substrate and rhizosphere soils as averaged across all analyzed plant species (n = 19). Error bars represent one standard deviation. The contribution of on average abundant (≥0.1%) and low-abundance (<0.1%) OTUs to changes between soils as well as their sum are displayed separately. A detailed distribution of bacterial phyla per plant species is given in Supplementary Figure S2.

