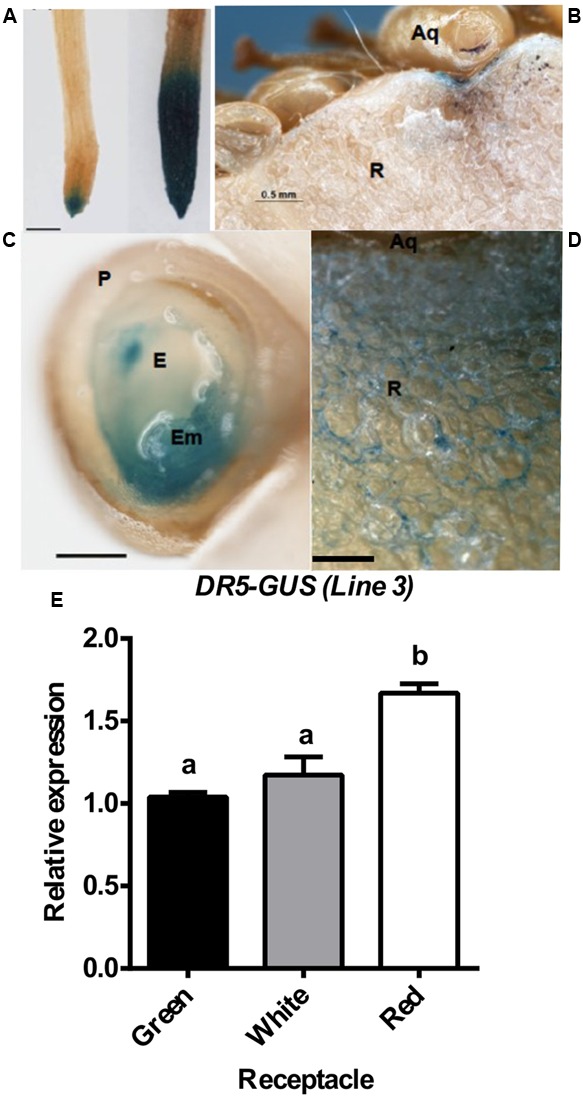
FIGURE 5.

Auxin distribution in strawberry. DR5-GUS expression pattern in strawberry roots (A) and green fruits (B–D). For the NAA treatment, in (A), plants were grown in vitro and treated with a solution of 50 μM NAA in water for 24 h (right), or just with water for control plants (left). Scale bars (B) = 500 μm, (C,D) = 250 μm,. P, pericarp; E, endosperm; Em, embryo; Aq, achene; R, receptacle. (E) Relative expression by qRT-PCR of the GUS gene in receptacle at three developmental stages. Different letters indicate a significant difference between samples according to the corresponding ANOVA (P < 0.05).
