Figure 3.
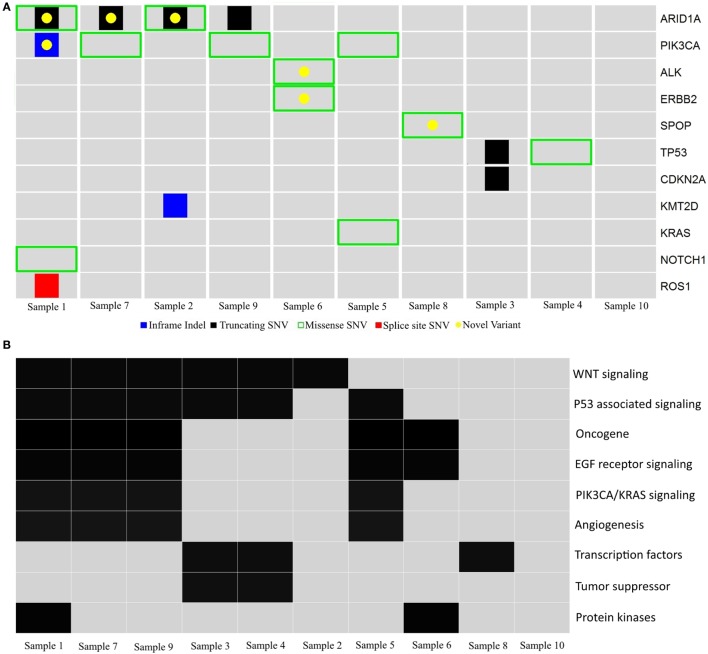
Schematic diagram of gene variants in ovarian clear cell carcinoma. (A) Illustration of probable somatic variants in genes (rows) across tumors (columns) in cohort 2. Red, splice site SNV; black, truncating SNV; green, missense SNV; blue, inframe indels; yellow, unreported variants. (B) Summary of pathways and gene families (rows) affected by probable somatic variants across tumors (columns) in cohort 2.

