Figure 5.
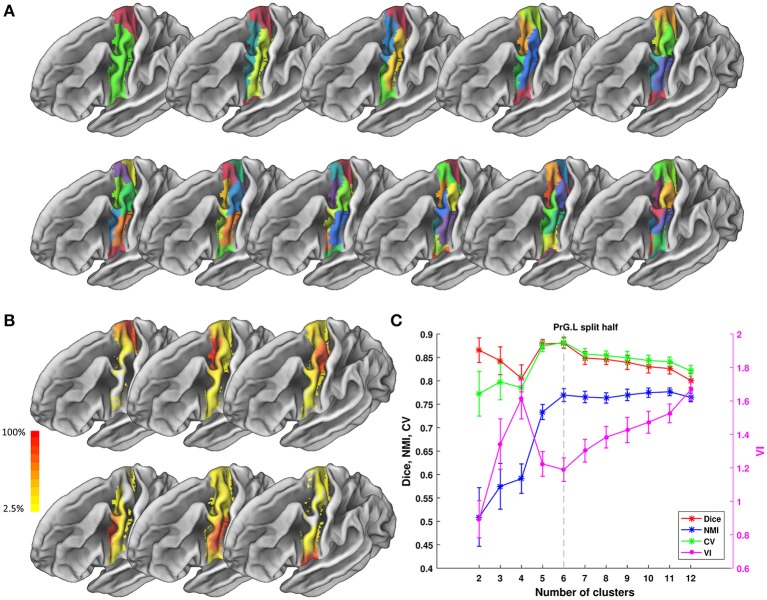
Parcellation results of left Precentral Gyrus (PrG.L) based on Chengdu data. (A) Maximum probability maps of PrG.L with 2-12 clusters solution. Note that there is no correspondence among subregions with the same color in different solution. (B) Probabilistic maps for each subregion in 6 clusters solution. The value of 1 indicates that the voxel belongs to the putative subregion across all subjects, i.e., there is low inter-subject variability at that voxel. Similarly, the lower values indicate higher inter-subject variability. (C) Validity indices of PrG.L in split-half resampling technique with 100 repetitions. The relative higher value of Dice, NMI, and CV and relative lower value of VI denote the more consistent parcellation across solutions. Error bars denote standard deviation. The optimal 6 clusters solution seems most reasonable according to those indices.

