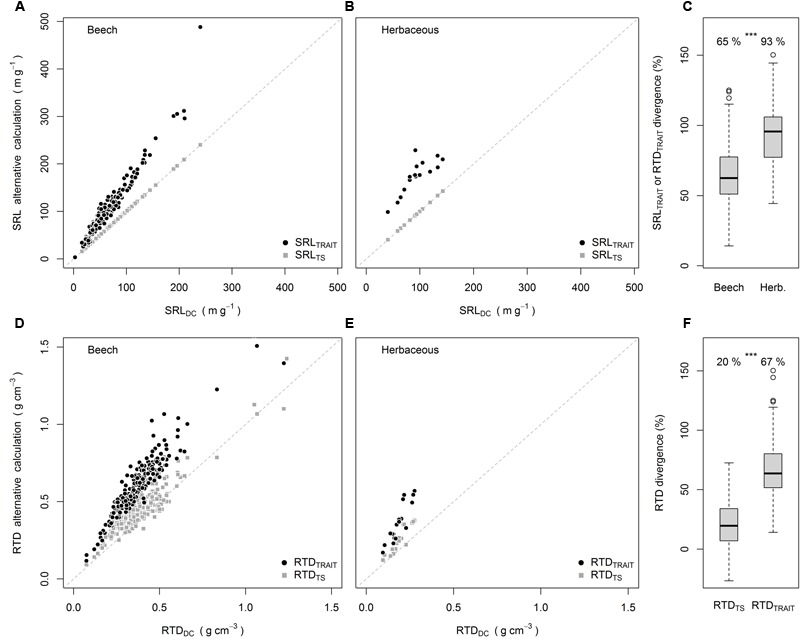
FIGURE 1.

SRLTRAIT and SRLTS plotted against SRLDC for beech (A) and herbaceous species (B), divergence of SRLTRAIT and RTDTRAIT from SRLDC and RTDDC (C), RTDTRAIT and RTDTS plotted against RTDDC for beech (D) and herbaceous species (E), average divergence of RTDTS and RTDTRAIT from RTDDC (F). Numbers in (C,F) are means, ∗∗∗ indicate significant differences [P < 0.001, Wilcoxon-test (C), paired t-test (F)] -between groups. All means in (C,F) were significantly greater than 0 (P < 0.001, one sample t-test).
