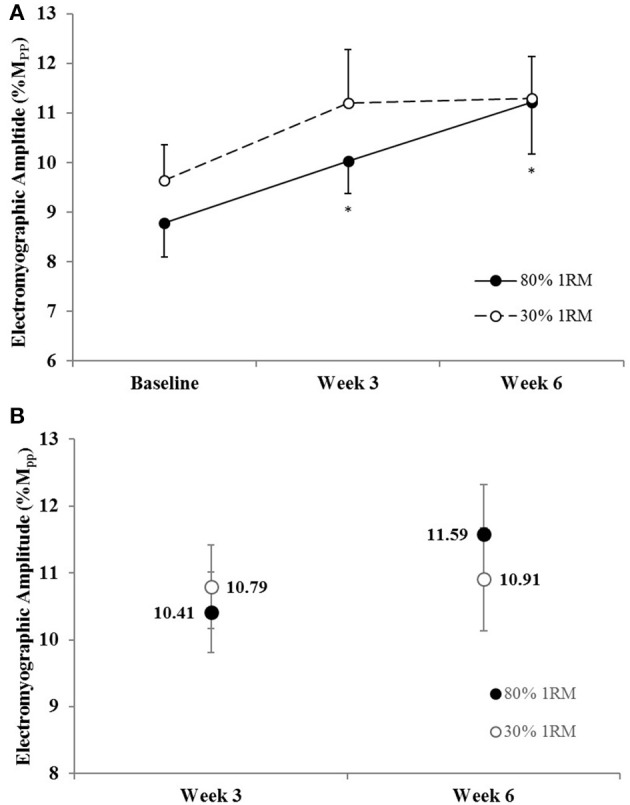
Figure 7.

(A) Normalized electromyographic amplitude in the 80 and 30% 1RM groups at Baseline, Week 3, and Week 6; and (B) adjusted means for electromyographic amplitude in the 80 and 30% 1RM groups at Week 3 and Week 6. Error bars are standard errors. *Indicates a significant increase from Baseline.
