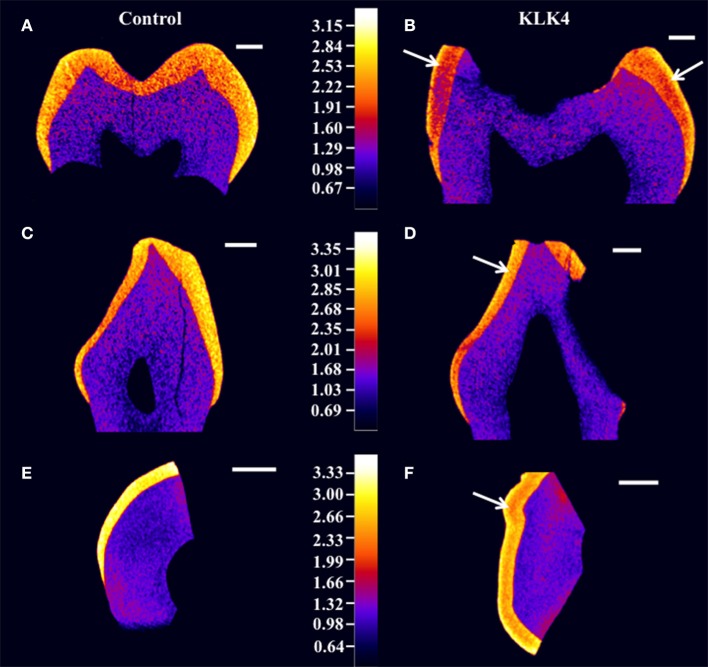
Figure 2.
High resolution X-ray CT analysis of WT control and KLK4 teeth from individual V:1 (family 1). (A,B): molar teeth, (C,D): canine teeth, (E,F): incisal tooth slices. Arrows indicate the presence of an inner layer of enamel of lower mineral density not seen in control teeth. Scale bars represent 1 mm.

