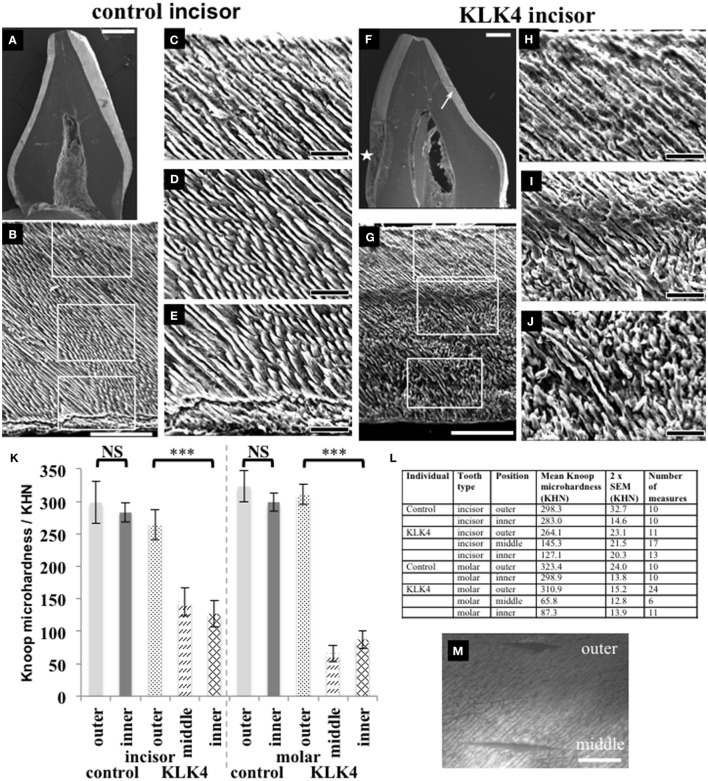
Figure 3.
SEM and microhardness testing of control and KLK4 teeth from individual V:1 (family 1). (A–E): Control tooth; (F–J): KLK4 tooth. (A): Whole tooth longitudinal section. (B): The enamel layer with the enamel surface shown at the top and the enamel-dentine junction at the bottom. White boxes indicate the positions of magnified images (C,D) and (E) respectively (top to bottom). (C–E): outer (C): close to the surface; middle (D) and inner (E): close to the EDJ, enamel. (F): Whole tooth longitudinal section—note the clear demarcation in the enamel layer between the inner and outer enamel on the lingual side of the tooth (arrow). An area of decay is present on the one side of the tooth (star). (G): The enamel layer with surface at the top and the enamel-dentine junction at the bottom. White boxes indicate the positions of magnified images (H–J) respectively (top to bottom). (H–J): outer (H): close to the surface: middle (I) and inner (J): close to the EDJ, enamel. (K): Knoop microhardness testing for control and KLK4 incisor and molar teeth. Error bars represent 2x standard error of the mean. Brackets indicate the conditions for which unpaired, two-tailed T-tests were undertaken. Results are abbreviated as follows: NS; not significant, i.e., p > 0.05; *** significant at p < 0.001. (L): Knoop microhardness testing results in table form. (M): Light microscopy image showing two indentations made around 100 μm apart on the KLK4 incisor tooth, one in the outer enamel layer and the other in the middle enamel layer. Scale bars represent (A,F): 1 mm; (B,G): 100 μm; (C–E) and (H–J): 25 μm; (M): 50 μm.

