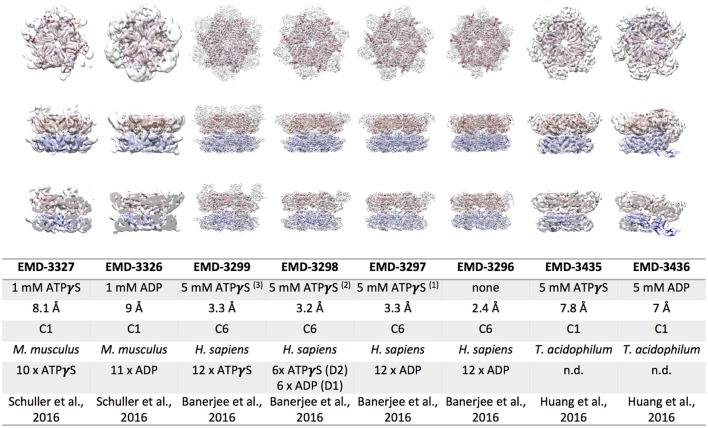
Figure 2.
Cryo EM reconstructions of p97/VAT obtained in the presence of ATPγS or ADP. Top view (upper row), side view (middle row) and cut open side view (lower row) surface representations of EM maps (white) fitted with the respective p97 model are shown. The color code is as follows: p97 NBD1, red; p97 NBD2, blue. The table lists the electron microscopy database (EMD) accession codes, the nucleotide present during data collection, the resolution obtained, the symmetry applied during refinement, the source organism, the number nucleotides bound to the complex, and the reference for each EM reconstruction.

