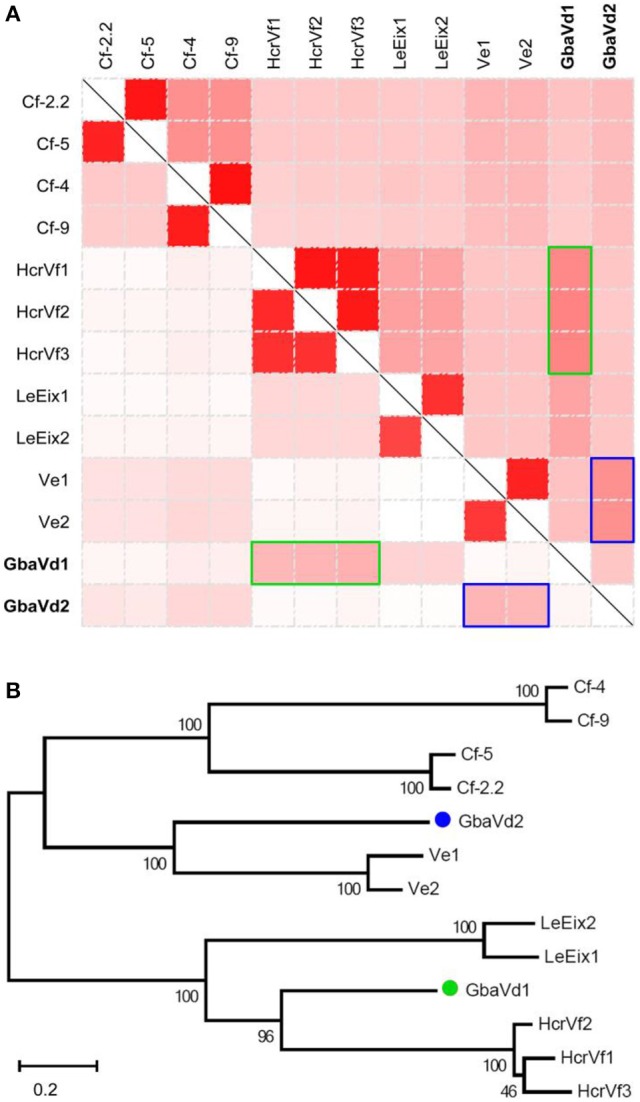
Figure 1.

Analysis of GbaVd1 and GbaVd2 sequence characteristics. (A) Homology analysis of GbaVd1 and GbaVd2 with known RLPs. The upper-right and bottom-left represent identical nucleotide and encoding protein sequences among RLPs, respectively. The colors, from white to red, represent the percentage identities, from 0 to 100%. The green and blue rectangles represent the best hits of RLPs with GbaVd1 and GbaVd2, respectively. (B) Phylogenetic tree of GbaVd1 and GbaVd2 with homologs from other plant species. The analysis was performed using the package MEGA6 with the Maximum Parsimony method.
