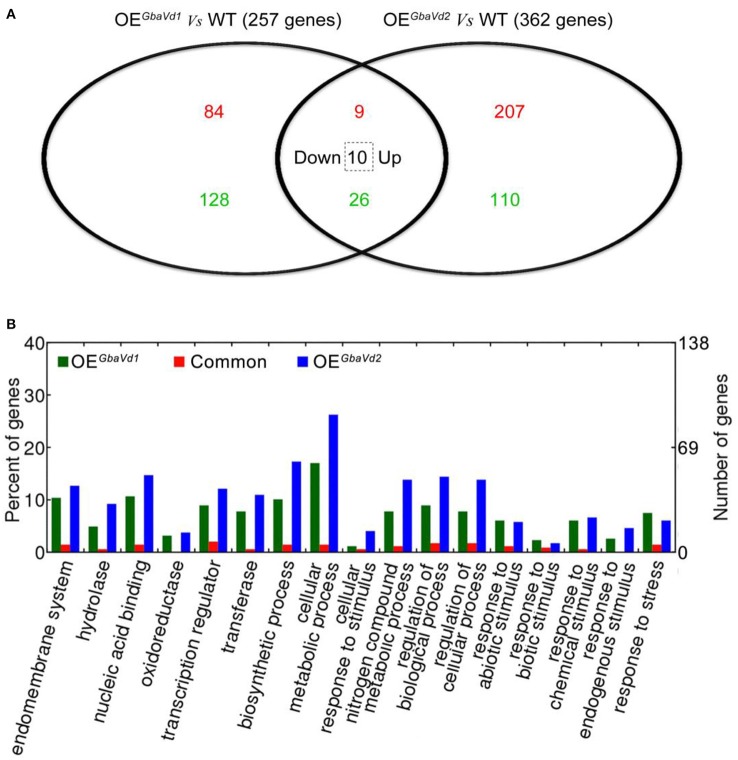
Figure 5.
Microarray analysis of differentially expressed genes in GbaVd1 and GbaVd2 transgenic lines. (A) The Venn diagram represents the differentially expressed genes between the transgenic and wild-type (WT) lines under normal conditions. The red numbers represent the up-regulated genes, the green numbers represent the down-regulated genes, and the number in the dotted box represents genes down-regulated in the GbaVd1 transgenic line but up-regulated in the GbaVd2 transgenic line. (B) GO analysis of differentially expressed genes in GbaVd1 and GbaVd2 transgenic lines.

