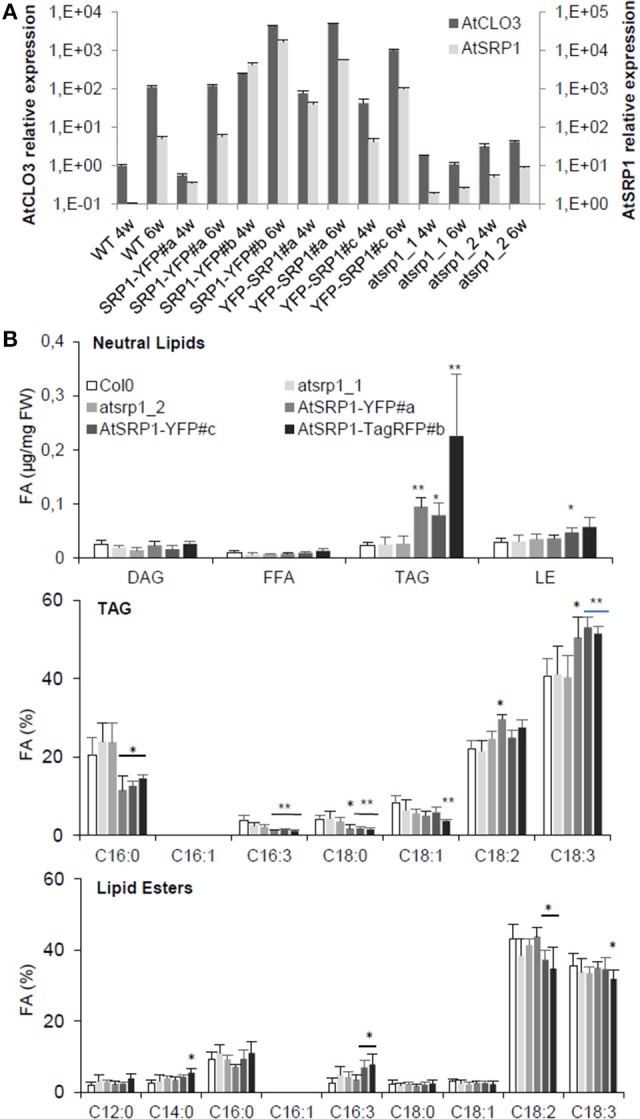
Figure 4.

Impact of AtSRP1 misexpression on AtCLO3 expression and neutral lipid metabolism. (A) Relative quantification of AtCLO3 and AtSRP1 expression in wild-type (WT), AtSRP1 overexpressors (SRP1-YFP and YFP-SRP1), and atsrp1 knock-down (atsrp1_1 and atsrp1_2) lines. Relative expression levels of AtSRP1 were determined by quantitative RT-PCR in 4 (4w) and 6 (6w) week old plants, and normalized to three reference genes: actin, GAPDH, and eIF4A-1. Relative expression quantities are represented related to wild type level at 4 weeks, which was set to one. Error bars represent standard deviation of technical replicates. Similar results were obtained when repeated with different plants (see Figure S8). (B) Neutral lipid analysis of AtSRP1 knock-down or overexpressing leaves. Lipids from 6 week-old leaves were quantified by GC-FID after transesterification. Neutral lipid quantification (in μg of fatty acid (FA)/mg fresh weight) is represented in top panel, triacylglycerol (TAG) fatty acid composition (in % of total FA) in middle, and lipid ester fatty acid composition (in % of total FA) in down panel. Values represent average and SD from six biological replicates. Statistically significant differences from the wild type are indicated by *p < 0.05 or **p < 0.01 as determined by Wilcoxon's-test.
