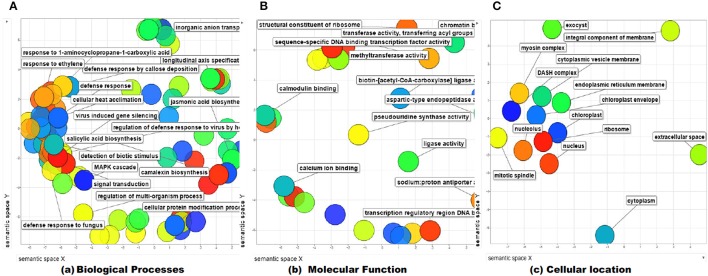
Figure 12.
Gene ontology enrichment analysis using ReviGO web server. The functional and significant GO terms were shown on scattered plot digramme using hypergeometric test distribution in terms of their controlled functional vocabularies (A, biological process; B, molecular function; and C, cellular processes involved).

