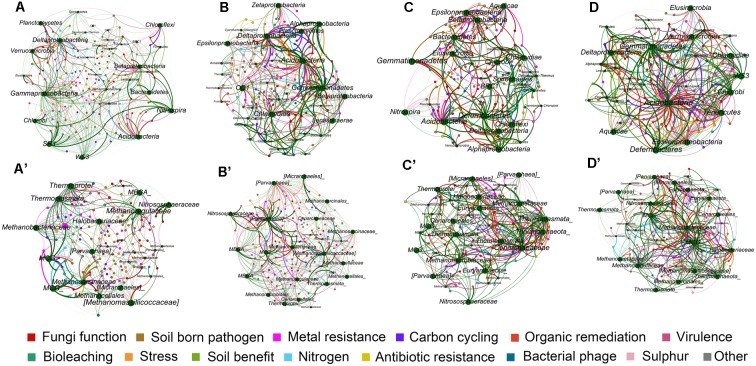
FIGURE 5.
Mutualistic networks of interaction between bacterial community and functions of the four soil profile layers (A–D), and archaeal community and functions (A′–D′). Edges in green colors represent influence of microbes to ecological functions, and edges in other colors represent influence of each functional category to microbes.

