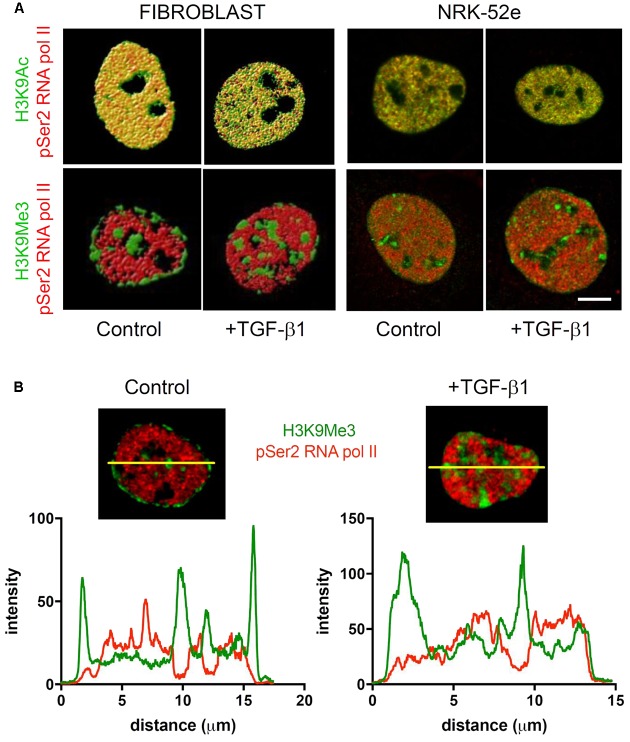
FIGURE 10.
Sub-nuclear localisation of transcriptionally permissive H3K9Ac and transcriptionally repressive H3K9Me3 in response to TGF-β1. (A) Volume rendered confocal images of nuclei from cells incubated with and without exogenous TGF-β1. Merged micrographs compare localisation of H3K9Ac (green)/H3K9Me3 (green) with phosphorylated RNA polymerase II (pSer2 RNA pol II) (red) in fibroblasts and proximal tubules (NRK-52e). Yellow indicates co-localisation of mark and pSer2 RNA pol II. Scale bar = 5 μm. (B) Co-localisation of staining intensity for H3K9Me3 and pSer2 RNA pol II at a central nuclear plane (yellow line) in a nucleus from each group.

