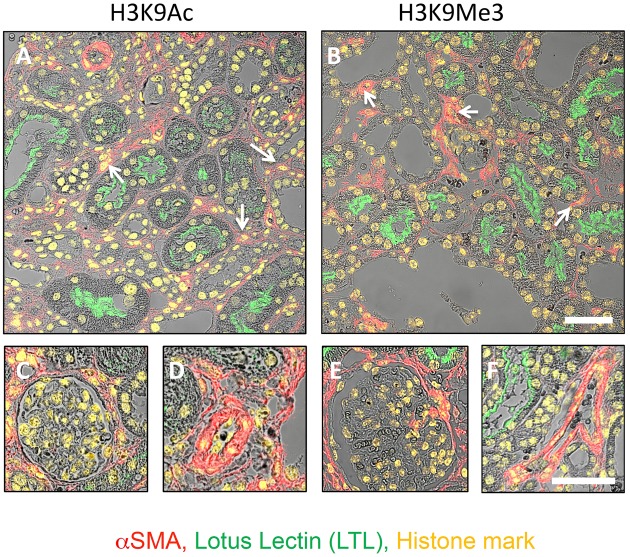
FIGURE 4.
Distribution of H3K9Ac and H3K9Me3 marks in the kidney after unilateral ureteric obstruction. Combined confocal and brightfield microscopy of sections from an animal 10 days after UUO triple labeled for each histone mark (yellow), LTL (proximal tubule brush borders; green) and αSMA (myofibroblasts; red). Micrographs illustrate the distribution of each mark in the tubulointerstitium (A,B), glomerulus (C,E), and vasculature (D,F). Examples of histone mark positive myofibroblasts are shown with white arrows. Scale bar top panels = 50 μm, bottom panels = 25 μm.

